Carmenta Engine FAQ
Carmenta Engine FAQ - Frequently Asked Questions
Navigating the map
Making Map Configurations
Application data
How can I test new visualization settings, without re-starting my application?
How do I let my users interact with my objects on the map using the mouse?
How do I let my users draw objects like symbols, lines and polygons using the mouse?
How do I add or remove geodata files while an application is running?
Background map layers
Raster data
How can I avoid poor display of images when zooming out in a raster map?
How can I visualize numeric data rasters, such as elevation models?
How can I avoid poor performance when zooming out in a raster map?
Vector data
Carmenta Engine version 5 compared to version 4
Is Carmenta Engine 5 backwards compatible with Carmenta Engine 4?
How do I migrate Carmenta Engine 4 application source code to Carmenta Engine 5?
Can Carmenta Engine 4 and Carmenta Engine 5 co-exist on the same PC?
Coordinates
How can I parse and format MGRS (Military Grid Reference System)?
How can I parse and format UTM (Universal Transverse Mercator)?
How can I transform coordinates between different coordinate systems?
3D
How do I visualize and move objects representing my application data in 3D?
Can I visualize my objects as 3D models of aircrafts, vehicles etc?
Miscellaneous
How do I draw a transparent interface on top of a map? (C++ with Qt)
What are Carmenta Engine hardware requirements and graphics card recommendations?
Navigating the map
How do I let my users pan and zoom the map?
The easiest is to activate the StandardTool on the MapControl, it has panning and zooming built-in. It is the interaction tool that is used in Carmenta Explorer for navigation. Another common technique to do zooming is to have two buttons in the user interface, zoom in and zoom out, that when clicked will double the current View.NominalScale to zoom out or halve it to zoom in. After setting the nominal scale you also need to call View.Update to redraw the map.
How do I center the map on a specific location?
To re-center the map, all you have to do is to set the property center on the View object to a new point and then call View.Update to redraw the map.
The view is the root node in your map configuration that you have created in Carmenta Studio. If you are using one of the MapControls, you can get a reference to the view by calling IMapControl.View. So setting a new center on the view would then be:
myMapControl.View.Center = new Carmenta.Engine.Point(newX, newY);
myMapControl.UpdateView();
The unit for the X and Y depends on which CRS (Coordinate Reference System) that is currently set on the View. For example, if the View CRS is Wgs84LongLat, then X is longitude and Y is latitude in degrees, but if the View CRS uses a UTM projection, then X is easting and Y is northing in meters.
If your point is not in the same CRS as the View, you can re-project the coordinates from one CRS to another using the Crs.ProjectTo method.
How do I identify what my GlobeView camera is pointing at?
To find the center point of your screen use the method View.PixelToCrs combined with the width and height of the View.Drawable. Remember that the resulting Point might not be valid in case you are looking upwards beyond the globe.
Point centerPoint = myGlobeView.PixelToCrs.( GlobeView.Drawable.Width / 2, GlobeView.Drawable.Height / 2);
If you wish to find a selectable object, use the method View.WhatsAt using a pixel coordinate, or the method View.WhatsIn using a pixel area.
Zooming in my application is slow, what can I do?
Make sure that the GUI thread is free from heavy calculations and event handling that can cause lag, use background threads instead, see Efficient Integration of Map Controls in GUI Applications.
Additionally, on the relevant layers, use Layer.EnabledDuringQuickUpdates to disable process heavy layers during tool interaction. Remember to enable QuickUpdates on the tools, ie. StandardTouchTool.QuickUpdateEnabled.
Making Map Configurations
Can I avoid hard-coded paths and use relative paths inside map configurations files?
Setting relative paths is one of the best ways of preparing for good and easy deployment, i.e. "copying map configuration and data to a different location without changing anything".
Relative paths inside a map configuration file are relative to the location of the map configuration file (.px).
For example:
To access files in "c:\maps\geodata\images" from inside "c:\maps\mymapconfig.px", you could simply set path properties to ".\geodata\images". This works for all types of paths: geodata, symbols and other resources.
By the way, in Carmenta Studio, if you write the path directly into the right hand column of the object editor, do not write the quote marks:
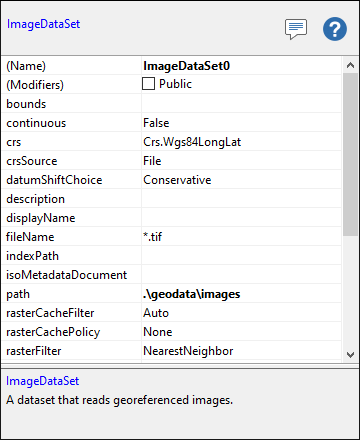 |
How can I handle the same value on multiple objects in Carmenta Studio, for instance, having a common root path for DataSets?
There are some utility objects in Carmenta Studio that can be used to encapsulate strings and paths (and other types). That way you can refer to the same object from multiple objects, and if you need to change the path you only have to change the value at one place. You find these objects in Carmenta Studio Classes → Miscellaneous.
I have set up a geodata root path in the Windows Registry, can I set up my map configuration to use it?
Yes, there are utility objects in Carmenta Studio that can be added to a map configuration which will read string values from the registry or environment variables. This way your users or your installation programs can set registry or environment variables that defines where they have put their data.
You can also use a ConfigurationParameter (not available in C#) object in the map configuration which the application can replace with a value it gets from somewhere else (like the registry).
How do I split my configuration file into smaller ones?
For the general problem of splitting a configuration file into smaller ones, a common technique is to move objects that inherit from ResourceObject into separate files. For example, one can move all DataSet definitions into a separate file that can be referred from many other files. Each DataSet definition should be checked as being "Public" in the Property Editor in Carmenta Studio. Additionally, you should check the "Shared" checkbox for the whole datasets configuration: this checkbox will appear in the Property Editor when you click in the background of the big data flow window.
Another common technique is to make use of the LoadableLayer/LoadLayerSet functionality. This functionality makes it possible to create a LoadableLayer in one px-file and then load it into another px-file by using a LoadLayerSet. Thus, this functionality makes it easy to split layers into separate configuration files.
Application data
This section addresses some of the most common questions regarding how to display your own, usually dynamic, data on the map. We refer to this kind of data as application data or application objects.
How do I display my own objects on the map?
The most common way to display your own data on the map is by adding a new Layer that is drawn on top of the background layers. You can either add this to your map configuration file (.px) using Carmenta Studio, or use the API to construct the layer programmatically at runtime. This layer typically has a VisualizationOperator with one or more Visualizer objects with the visualization parameters that you need. The layer should also contain a ReadOperator with a MemoryDataSet attached to it.
Next, in your application code, create Feature objects that represent your application data and insert them into the MemoryDataSet in the layer. On the next map window update, the features should appear on top of the map.
Another way of displaying your application data on top of the map is to let the draw application draw it on top of the View. This is accomplished by hooking the View.CustomDraw event on the View and draw the application data using the drawing methods on Drawable. Use the View.crsToPixel() method to convert View.Crs coordinates to pixel coordinates.
Can my objects have different colors, symbols etc?
In order to differentiate between different application objects in the map, the features must be given attributes which make them distinguishable from each other. These attributes can be referenced by visualizers, whose color, font or symbol can be an attribute variable that depends on an attribute of the feature. Attributes can also be used for filtering, perhaps with the goal of hiding certain objects at certain scale levels, or to filter different object groups into different layers.
How can I test new visualization settings, without re-starting my application?
It is often useful to test the visualization using Carmenta Explorer. This can be accomplished by creating the layer and operator structure as defined above to the .px-file and at the same time adding some features (that is typical for your data) to the MemoryDataSet using Carmenta Studio. This usually saves a lot of development time, since starting Carmenta Explorer is usually faster than starting the real application.
How do I move objects on the map using the API?
To move a feature, that represents an application object, using the API you simply change its coordinates. The next time the map window is re-painted the object will move to the new location. The coordinates are found in the Geometry associated with the feature. The Geometry.Move method may also be used to move a feature.
An application must also take care to synchronize access to features correctly when they are modified so any background threads in Carmenta Engine does not access them at the same time.
See Threading Model, datasets and features for more information.
How do I let my users interact with my objects on the map using the mouse?
Activate the StandardTool on your MapControl. The StandardTool can select and edit objects. If you want to know when an object is selected or have been edited you can use the events on the StandardTool and MemoryDataSet. Make sure that the layer containing the objects and all its parent layers are selectable (have their selectable property set to true).
How do I let my users draw objects like symbols, lines and polygons using the mouse?
Activate the CreateTool on your MapControl. The CreateTool can draw points, lines and polygon Features as well as advanced tactical graphics.
How do I get to a specific Feature?
When you create a Feature and put it into a DataSet you will get an unique id. If you want to get to the feature later, you can ask the dataset for it using the id. Or, more efficiently, you can keep an object reference in a variable that refers to created Feature, and then later use the variable to access the feature.
How do I dynamically change the appearance of an object, for instance rotating it in the direction of travel?
To rotate the text or symbol or 3D model that is displayed for a feature, add a numeric attribute to the feature that defines its rotation (in degrees), and make the PointVisualizer.Rotation property be an IndirectAttributeVariable<System.Double> whose key is the name of the attribute that contains the rotation.
How do I update a text label for an application object?
To update a text label for a feature, for instance a position string, ensure that the TextVisualizer.Text is an IndirectAttributeVariable<System.String> whose key is the name of a text attribute of the features. Then you only need to change the value of the attribute between updates, and the label will update accordingly.
How can I place labels?
A text label can be aligned in various ways; see AlignX and AlignY. It is also possible to add some additional offsets; see PointVisualizer.OffsetX and PointVisualizer.OffsetY .
To make a street name follow a curved street, use TextVisualizer.FollowLine = True.
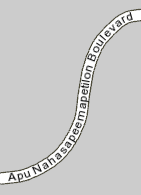 |
You can find examples in the configuration sample text_visualization.px.
A label containing a two-column table is more difficult.
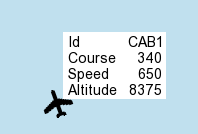 |
We want the left hand column to be left-aligned, but the right hand column to be right-aligned since it contains numbers. See PointVisualizerSet to learn how this table was created. (A similar example can be found in the configuration sample point_visualizer_set.px.)
Carmenta Engine also provides sophisticated automatic label placement that can be used to minimize overlapping labels in a map.
How do I display tactical symbology?
Carmenta Engine Tactical Extension provides support for adding Military Standard 2525B Change 1 symbology to your application. By adding a TacticalVisualizer to your configuration and assigning a MilStd2525BParameters to this visualizer, Feature objects will be visualized as warfighting symbology according to its specified attributes (refer to MilStd2525BAttributes for a list of these attributes). The Feature objects are most commonly held by a MemoryDataSet. See Tactical Extension for more detail.
Can the visualization depend on user manipulation?
It is easy to display selected features in a special way: you construct the special visualizers and insert them into the VisualizationOperator.SelectionVisualizers.
For a feature that is not selected, but over which the cursor hovers, there is no built-in way to use special hovering visualizers. But if you use the StandardTool, you can let StandardTool.HotTrackingEnabled = True, which will replace the default Cursor by the SelectFeature variant when the cursor hovers over a selectable feature.
Can I change the visualization per feature?
The color, size and many other properties that determine how a single feature will be visualized can be derived from the attributes associated with the feature using attribute controlled visualization.
Can I change the visualization globally?
Update attributes can be set on each View. The update attributes will be available for all operators and layers below the view during a map update. They can be used to affect the global visualization in a view, for example by turning on and off layers and operators, or to change the color or transparency of all or a group of layers. If you have CustomOperators doing demanding calculations, you can use update attributes to only do the calculations when needed.
There is a number of predefined update attributes. The quickUpdate attribute is used to disable specific layers during a series of updates that needs to be quick, for example during panning or zooming of the map and is used by the StandardTool.
Can I modify the configuration in runtime?
During the applications lifetime, you often want to change what is displayed in the map. This can be done in several ways, for example by:
Enabling and disabling individual layers
Adding additional background maps or changing the background map
Adding or removing layers with application data
Can I enable and disable layers during runtime?
All layers have an enabled property that tells whether the layer will be drawn when the map is updated. The preferred way to turn a layer on or off during runtime is to change this property, for example through a layer control.
The layer properties MinScale, MaxScale and Condition are also used to determine if the layer will be drawn in the map.
How do I add or remove geodata files while an application is running?
There are two alternative ways to handle this: one automatic and one manual.
The automatic way is to use the DirectoryDataSet, which will monitor its data directory for newly added or changed files. However, this approach has some limitations, for example it can handle only a limited set of file formats.
The manual way is to use a plain dataset (not a DirectoryDataSet). But a plain dataset assumes that its data files are static, so when the files have been changed, the application must create a new instance of the dataset based on the new files, and use the Global Configuration Lock to attach the new dataset to the ReadOperator.
Best practice is always to use a unique name for all of the updated/changed data files, for example attach date and time of creation/modification.
Can I add and remove layers during runtime?
It is possible to add new layers to the View after the configuration has already been loaded. To do this, you can either load a Configuration file that contains a public Layer or create a layer chain in code and then attach it to the View or a LayerSet beneath the view.
The layer can for example contain a ReadOperator with application objects generated in runtime in a MemoryDataSet, or a new raster background map.
Layers can also be removed from the view by removing them from their parent's View.Layers or LayerSet.Layers collection.
Can I save the configuration during runtime?
The Configuration class have methods to save parts of a configuration to a Carmenta Engine configuration XML string or file. This can be used to save a configuration that has been built or modified in runtime, with the current layers and settings of the configuration.
The SaveMode enumeration can be used to even save point, line and polygon features in all MemoryDataSets. This can be used to save the state of the application for debug purposes, or for having test features to use when configuring the feature visualization in Carmenta Studio.
Background map layers
This section is about the static data and maps that is background for your application features.
How do I improve the performance of background layers in my map?
First we recommend that you test the map configuration in Carmenta Explorer and use built-in profiler to see where the actual bottle necks are. From the Profiler results you can see which layers that are causing the problems and which processing parts of these layers that you should focus your optimization attempts on.
It could be that the map simply tries to display too much data at the same time. If so, you need to apply some filtering techniques in your map configuration file. One base technique is to turn off a layer when you are zooming out by using the Layer.MaxScale functionality. You could also try to apply on-the-fly line thinning using TileLayer.AutoThin (used by default) or a LineThinningOperator if the data are lines or polygons.
It could also be that the data is read from a slow format (text based formats are usually quite slow) or that there are too many features per data file.
If the data is slow to read from disk one solution might be to turn on Feature Index on the DataSet if it is available for that dataset (it is available for ShapefileDataSet for instance). You turn the feature index on by setting the FeatureIndexPath property to a valid path. Turning on the index will generate index files the next time the map configuration is loaded.
Have you put your layers into a TileLayer so that the data is loaded asynchronously and are cached on the graphics card?
Another variant using the TileLayer is to turn on the built-in bitmap file cache feature in TileLayer to store the tiles as image files on disk. This is a brute-force approach that works with all kinds of high density data, since when the tile has been processed and been cached it will be handled like a simple image.
If it is raster data, perhaps the poor performance is because you are forcing a re-projection (warping) of the raster data. To avoid re-projection of raster data, try to have the same Crs (coordinate reference system) on the View as on the data). If you do not know the CRS of the data you can use a SpyOperator to save information about the data to a text file.
Another common reason for poor performance when handling raster data is that the data is read in its original resolution for all map scales. For instance, GdalDataSet supports generation of low resolution variants of the data, called overviews, that will automatically be read when zoomed out.
How can I dim the background?
The background layers should usually be shown with dim colors, so that your application features stand out. The easiest way to dim the background layers is to lower their Layer.Opacity.
In Carmenta Explorer, you can directly modify a layer opacity. Select a layer in the layer tree, and choose Tools → Change Opacity...
See also the Working with Raster Data.
Raster background
Background maps are often in the form of raster maps, since these can be displayed efficiently. Raster maps can be classified into
Image rasters (which consist of colors), and
Data rasters (which consist of numbers).
The numbers in a data raster may represent a physical quantity like elevation, or may represent thematic categories like WATER, FOREST, CITY, ... Carmenta Engine can interpolate between colors and between true numbers, but it makes no sense to interpolate between discrete integers that represent WATER or FOREST. To signal that interpolation is allowed, the continuous property - available on some datasets - should be True.
Raster data
How can I avoid poor display of images when zooming out in a raster map?
The display of raster images can be controlled via a RasterFilter, which is NearestNeighbor by default. Setting it to Bilinear or Bicubic will make the zoomed-out display smoother. If the raster is an image that has been fetched directly from a dataset, then you can modify the rasterFilter property on the dataset. If the raster image has been generated from elevation data by a ShadeOperator, then you can specify the filter on the shade operator. And if your configuration contains an explicit RasterVisualizer, then you can specify the filter on the raster visualizer.
How can I visualize numeric data rasters, such as elevation models?
Carmenta Engine provides several options for you, for example ShadeOperator or IsolineOperator. See the Working with Raster Data for more information.
The configuration sample topographic_map.px should also be helpful.
How can I avoid poor performance when zooming out in a raster map?
Use overviews; see the Working with Raster Data for more details.
Vector data
How do I use vector data efficiently?
See the Working with Vector Data.
My vector features are selectable, why isn't the TouchTool selecting them?
The StandardTouchTool has built in event handling for selecting features on a map, however, sometimes the StandardTouchTool.TouchRadius is not correctly initialized. The value should be read from hardware, although, if selecting features isn't properly working, please try and set an explicit value. For example, somewhere between 2-5.
Carmenta Engine version 5 compared to Carmenta Engine version 4
Is Carmenta Engine 5 backwards compatible with Carmenta Engine 4?
No, Carmenta Engine 4 applications must be migrated to use the new Carmenta Engine 5 API. And map configuration files (.p) must be migrated to the new XML-based (.px) format.
How do I migrate Carmenta Engine 4 application source code to Carmenta Engine 5?
The basic principles are still the same, most objects are still there, but some of them have new names. In practise, migration is done by going through your application's source code line by line changing all Carmenta Engine 4 API calls to Carmenta Engine 5 API calls. There is a migration guide that will assist you with this and other migration topics.
How do I migrate Carmenta Engine 4 map configuration files (.p) to Carmenta Engine 5 map configuration files (.px)?
Carmenta Studio has a built-in (.p) to (.px) converter. Just open a (.p) file in Carmenta Studio and save it again as a (.px) file.
Can Carmenta Engine 4 and Carmenta Engine 5 co-exist on the same PC?
Yes, Carmenta Engine 4 and 5 SDKs, and applications using the Carmenta Engine 4 or 5 Runtime can co-exist on the same machine.
Coordinates
How can I parse and format latitude and longitude?
There are many different format conventions for latitude and longitude.
Example | format description |
|---|---|
57,70969° N 11,96505° Ö | decimal degrees and Swedish abbreviations, with decimal comma |
57° 42.5814′ N 11° 57.9031′ E | degrees and decimal minutes, with decimal dot |
N 57:42.5814 E 11:57.9031 | degrees and decimal minutes, colon-separated |
57 42.5814 с. ш. 11 57.9031 в. д. | degrees and decimal minutes, blank-separated, Russian abbreviations |
5742.5814N 01157.9031E | degrees and decimal minutes, no separator, zero-padded (CJCSI 3900.01C, Position (point and area) reference procedures) |
N 57° 42′ 34.88″ E 11° 57′ 54.18″ | degrees/minutes/seconds |
N 57d42'34.88" E 11d57'54.18" | degrees/minutes/seconds, keyboard-friendly separators: lowercase d instead of degree symbol °, vertical single quote ' and double quote " instead of slanted prime ′ and double prime ″. |
57:42:34.88 N 11:57:54.18 E | degrees/minutes/seconds, colon-separated |
N 57 42 34.88 E 11 57 54.18 | degrees/minutes/seconds, blank-separated |
+574234.88 +0115754.18 | signed degrees/minutes/seconds, zero-padded, no separator |
+57.423488 +011.575418 | signed degrees/minutes/seconds, in a format that looks like decimal degrees but isn't (EPSG sexagesimal DMS) |
64.12188 13.29450 | signed gon (also known as grads) |
1.0072241 0.2088295 | signed radians |
There are more variants than we can support, so it is your own responsibility to handle the concrete syntax in your application. But Carmenta Engine has some auxiliary methods that can help you with the abstract syntax; the methods convert between degrees (as numbers) and multi-string representations of either degrees/minutes/hemisphere or degrees/minutes/seconds/hemisphere, with English abbreviations for the hemispheres (N, S, W, E). Then, you can write your own application code to print and parse the separators you want. See Crs.ParseLatitude, Crs.ParseLongitude, Crs.FormatLatitudeAsDegreesMinutes, Crs.FormatLatitudeAsDegreesMinutesSeconds, Crs.FormatLongitudeAsDegreesMinutes and Crs.FormatLongitudeAsDegreesMinutesSeconds. There is a sample application that uses these methods, see #engine#Height Calculator Sample .
The GridGenerator can display the latitudes and longitudes of a graticule in a few standard formats.
See also the article Geographic Coordinates: Latitude and Longitude.
How can I parse and format MGRS (Military Grid Reference System)?
For MGRS, the alphanumeric way to write UTM and UPS coordinates, you can use the methods Crs.ParseMgrs and Crs.FormatMgrs. The UtmGridGenerator can annotate a UTM grid in the MGRS style. See also the article Projected Coordinates.
How can I parse and format UTM (Universal Transverse Mercator)?
There are various ways to write UTM coordinates. Proper UTM notation is right-handed: the easting is written before the northing. If there are no decimals, the easting will have six digits and the northing seven. The northing will be less than 1 000 000 meters between latitudes 0° and about 9°N, but is then often written with leading zeros. Also, some people prefer to write the easting with seven digits, too, by giving it a leading zero.
In addition to easting and northing, you need to specify UTM zone number and either hemisphere (North/South) or latitude band letter (C to X, excluding I and O). These can be written either before or after the easting and northing.
Example | format description |
|---|---|
32 North 676644 6400255 | zone, hemisphere, easting, northing |
32 North, 676644 m E, 6400255 m N | the same, but with abbreviations for meters East and meters North |
676644, 6400255, zone 32 North | zone and hemisphere comes last |
32V 676644 6400255 | latitude band letter instead of zone |
32 676644 6400255 | the hemisphere is omitted and assumed to be clear from context (risky) |
Without a hemisphere or latitude band letter, a UTM position is ambiguous, since the same range of northings are used on the north and the south hemisphere. It is sometimes assumed that the hemisphere is clear from context, since the two possible interpretations would be 10 000 km apart, but in these days of global operations it is a risky assumption.
The latitude band letter, which is often given instead of hemisphere, is not part of pure UTM, but comes from the MGRS notation, which is an alphanumeric way to write UTM and UPS positions. Each letter (except X) denotes an 8-degree latitude band, so C denotes the band 80°S to 72°S, and D denotes the band 72°S to 64°S, and so on, skipping I and O, until X denotes the 12-degree band 72°N to 84°N.
When a hemisphere is specified instead of a latitude band letter, the hemispheres are sometimes abbreviated to N and S. Since these abbreviations can be mistaken for latitude band letters, this practice in not allowed by NGA (US National Geospatial-Intelligence Agency), but the full names North and South can be accepted.
So, how can Carmenta Engine help you with parsing and formatting?
To parse UTM, your application must find out the zone, hemisphere, easting and northing. If there is a latitude band letter instead of a hemisphere symbol, remember that N is the first band letter for the north hemisphere, so band letters before N in the alphabet means the south hemisphere. (If you are ambitious, your application could check that the latitude band letter is consistent with the UTM easting and northing.) To create a point Feature, you first create a PointGeometry whose point coordinates are the easting and northing. The PointGeometry is then used for the point feature, whose Crs can be constructed directly by the static method Crs.Wgs84Utm(zone, hemisphere), if the GeodeticDatum used for the UTM notation is Wgs84. Otherwise, first use the static method Projection.Utm(zone, hemisphere), to get the Utm projection, and then combine it with the geodetic datum of your choice, to get a new CRS (use the constructor Crs(projection, datum)). This point feature can then be reprojected to another coordinate reference system like Wgs84LongLat.
To format a point stored in longitude/latitude as UTM or UPS,
you can use the method Crs.FormatUtmUps, which automatically finds
out the appropriate UTM or UPS projection zone that should be used, and
then converts the point to UTM or UPS notation.
If your
point is already stored in UTM or UPS, then you should know
which UTM or UPS projection that is used, so you just have to print
the projection information and the X and Y components of the point
in the format you prefer, since X and Y is already the easting and
northing in UTM or UPS.
See also the article Projected Coordinates.
How can I transform coordinates between different coordinate systems?
See Coordinate Systems.
##What are the units of numbers?
The unit of a numeric property or parameter should be given in its documentation. There are some general principles for angles and lengths, though:
Angle units
For geographers, angles are usually in degrees, and if it is a direction from a point, the angle usually goes clockwise starting from north (or grid north). Most of the angles in Carmenta Engine should be expressed in the geographer's convention. But there are some low-level properties and parameters that should be expressed in the mathematician's convention: radians counterclockwise (and zero direction rightward). Furthermore, the angles in a HelmertDatumShift or a LongLatOffsetDatumShift must be expressed in arc seconds. There is a class AngleUnit that allows you to define your own angle unit, like arc minute or milliradian, but such a unit can be used only by the EquidistantCylindricalAngularProjection.
Length units
In Carmenta Engine, lengths are usually given in screen pixels, in meters, or in some Crs unit that could be meter or foot etc. but also degree if the CRS uses LongLat. Sometimes, only one choice is possible:
A Drawable is attached to a View that has a Crs, but the drawable itself is not aware of the CRS and knows only about pixels, so the length parameters of drawable methods are usually in pixels.
In a similar way, an instance of Geometry is usually attached to a Feature that has a Crs, but the geometry itself is not aware of the CRS, so length parameters to geometry methods must be expressed in the length unit of the feature CRS. The geometry does not know what the length unit is, but the application programmer can get it by calling Crs.GetLengthUnit on the CRS of the feature which can be retrieved through the Feature.Crs property, and can then convert to or from meters via the LengthUnit.FromMeter and LengthUnit.ToMeter methods .
Some lengths (for example RasterizeOperator.CellWidthor FeatureQuery.Resolution) must be expressed in the unit of some particular CRS, often one that appears somewhere near the number (in the configuration file or in the application code). Other lengths must be expressed in meters.
However, more choices are possible in a Visualizer; it has a LengthUnit property containing a value from the VisualizerLengthUnit enumeration, that controls whether other visualizer properties are in screen pixels, meters, or the unit of the View.Crs.
There is also another class, LengthUnit, that allows you to define ordinary units like meter, foot, or yard, but not screen pixels. This class can be used when defining a map Projection, and it can also be used by some operators, like EllipseOperator and BufferZoneOperator.
More generally, the UnitConversionOperator can be used to convert attributes of features from one unit to another. It can also convert angles between true north and grid north, or between meters and the length unit of the View.Crs.
3D
How do I visualize raster elevation data in 3D?
Start with a GlobeView and attach a ReadOperator with a DataSet reader to its elevationInput to read the elevation data. Make sure that you place the camera (GlobeView.cameraPoint property) where the data is.
How do I drape 2D map layers on the elevation data in 3D?
All you have to do is to copy the 2D layers from your 2D map configuration into your 3D map configuration and put them on the surfaceLayers of your GlobeView.
How do I let my users navigate in the 3D world?
The easiest way is to activate the StandardTool3D on the MapControl. Then it has panning and by using only the mouse, the user can easily move around the 3D view, zoom in or out on specific positions in the view, or rotate around interesting positions, controlling the camera position, bearing and pitch.
How do I visualize and move objects representing my application data in 3D?
Visualizing and moving objects in the 3D view are handled exactly the same way as you do in a 2D view (please see How do I display my own objects on the map? and How do I move objects on the map using the API?). Just make sure your features have altitude set (the z-value) in their geometry points.
Can I visualize my objects as 3D models of aircrafts, vehicles etc?
Yes, just use a Symbol3D as symbol on the SymbolVisualizer. For a list of supported 3D model formats, see Supported Model Formats.
How can I apply effects to my Surface Layers?
Carmenta Engine renders all GlobeView.SurfaceLayers into a single tile during rendering, this means that individual effects cannot be applied for SurfaceLayers. However, you can still apply surface effects by attaching them to GlobeView.GroundEffects.
Miscellaneous
When should I have my data in a TileLayer, and when should I have them in a layer directly in the view?
For layers that handle dynamic data (editable objects or objects that are moving), it is usually better to have them placed outside any presentation-caching layers like TileLayer or BitmapLayer, i.e. directly in the view.
Layers that handle static objects usually work better in a TileLayer or a BitmapLayer.
If you put dynamic data in a TileLayer you must call Layer.FlushCache every time you have added or changed the data inside it to force a re-read of data in the TileLayer cache.
How do I build a layer control?
It is common in map applications to display a layer control so that the user can turn on and off different layers in the map.
To extract all the layers that should be displayed in a layer control, it is possible to find all layers in the View by iterating over the View.Layers collection. The collection contains the layers that are inserted directly below the view. To get all layers that are shown in the map you need to iterate over the children of these layers too. All layers that can contain sub layers can be cast to a LayerSet.
If you have a check box beside the layers describing if they are enabled or not, its value should be collected from the Layer.Enabled property. If the Layer.Enabled property changes, the Layer.EnabledChanged event is emitted, which the layer control should listen to so that the state of the check boxes can be updated.
It is not always the case that you want to display all layers in the layer control. If a LayerSet contains several sublayers to describe the same type of feature it might be enough to only display the LayerSet in the layer control. One way around this is to set a property in the IUserProperties.UserProperties that describes whether the layer should be displayed in the layer control or not.
How do I draw a transparent interface on top of a map? (C++ with Qt)
Normally Carmenta Engine instantiates its own OpenGL context for a Drawable with OpenGL, which can make it hard to draw additional information on top of the map window. The ExternalDrawable can be used to give Qt control of the OpenGL context.
In order set up the use of an ExternalDrawable, do the following:
Create a class that inherits from QGraphicsView and MapControl (C++ base class) (not available in C#). This class will draw both your overlay Qt interface and the map.
Call the setViewport function with a QGLWidget.
Use the OpenGL context and drawable of the QGLWidget to replace the Drawable of your View with an ExternalDrawable. The ExternalDrawable class enables Carmenta Engine to draw the map on an OpenGL context set up externally.
The constructor of your class should now look approximately like this:
QMapGraphicsView::QMapGraphicsView(QWidget *parent)
	: QGraphicsView(parent)
{
	// Setup the QGLWidget used as viewport
	QGLFormat format = QGLFormat(QGL::SampleBuffers);
	format.setSampleBuffers(true);
	glWidget_ = new QGLWidget(format);
	setViewport(glWidget_);
	setViewportUpdateMode(QGraphicsView::FullViewportUpdate);
	setAutoFillBackground(false);
	glWidget_->setAutoFillBackground(false);
}
You also have to make sure that the QGraphicsView is updated when the map is redrawn. This can be done by subclassing QGraphicsScene and use its scene in your QMapGraphicsView. Call View.UpdateByMapControl in its drawBackground function.
void drawBackground(QPainter *, const QRectF &)
{
	grView_->view()->updateByMapControl(true);
}
This is all that is needed! You can now use standard Qt functionality to draw on top of your map.
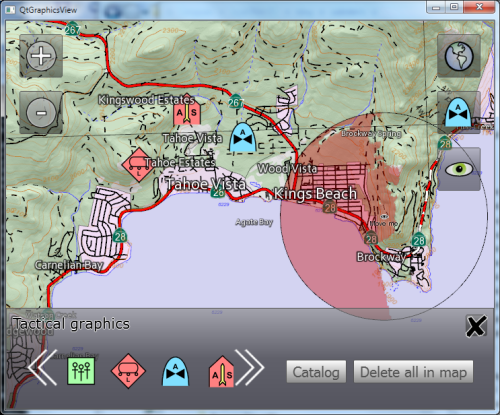 |
What are Carmenta Engine hardware requirements and graphics card recommendations?
The requirements for using hardware accelerated rendering using OpenGL or Direct X is specified in System Requirements. Our experience is that NVidia Geforce based cards are the best choice for most applications. NVidia Quadro cards can also be used, but usually they do not deliver the same rendering speed as the Geforce cards. ATI and Intel based cards should also run fine. Generally, we advice you purchase (or perhaps borrow) one graphics card first, test your Carmenta Engine application thoroughly on it (to make sure that it meets your expectations) before you purchase all graphics cards or units you need. There are differences and limitations in graphic drivers that may have high impact on specific applications.
Synchronized removal of symbol and text
The default behavior of the automatic label placement is to remove labels that are duplicates or that overlap other labels. However, if towns are visualized with both a symbol and a name, one often wants to synchronize the removals, so that symbol and name are removed together. (Otherwise, one can get town symbols without names, or vice versa, which can make the map harder to interpret.)
To get this synchronization, it is necessary to combine the symbol visualizer and the text visualizer into one PointVisualizerSet, but this approach is not compatible with the alternative positions that are generated automatically by the label-organizing layer. Because the automatic scheme would move the entire point visualizer set as one rigid unit, whereas we would like to keep the symbol fixed and move just the text.
So, to get both synchronized removal and alternative text positions, one must explicitly make alternative instances of the PointVisualizerSet, with the name in alternative positions relative to the symbol. For example, we can make four instances with the text appearing above, below, left of, or right of the symbol. All four instances are placed in the visualization operator, but at most one of them will be used for each town, since we let the label-organizing layer remove conflicts. And we set LabelOrganizingSettings.Count = 0, so that the layer will use only the explicit placement of each point visualizer set.
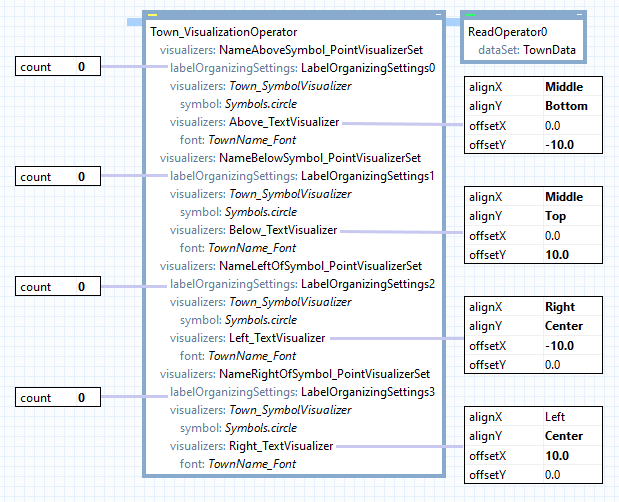 |
In the configuration above, the alternative text locations that are tried are the same as a single text visualizer would generate if its LabelOrganizingSettings had count = 4, dx = 10.0, and dy = 10.0.
I have a selectable feature containing a label/special visualization, how can I make the label/special visualization part non-selectable?
Features become selectable when Layer.Selectable is set to true. This includes all visualizers attached to the Layer. To remove this, set PickingSupport to None on the relevant visualizer.