How Carmenta Engine Displays a Map
Carmenta Engine uses a very modular approach for processing and visualizing geospatial information. In order to get the most out of the toolkit, it is important that you understand the purpose of the different types of objects that are used in map configurations, as well as how to connect them together to create your map.
We recommend that you read this document together with the Basic Vector Configuration Tutorial tutorial; it explains how to create the objects that are described below in Carmenta Studio.
The Data Flow Model
The figure below shows three of the most important classes in the Carmenta Engine object model. It also indicates how they are connected together to create a basic map configuration.
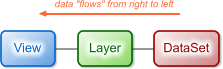 |
The View is the Carmenta Engine representation of a visualized map. The most common way to use a View is to connect it to a MapControl to display a map in an application window (you can also use Carmenta Explorer to display a View in a map configuration file). The View contains properties for controlling the geographical area that should be displayed, as well as methods for redrawing the map.
The Layer forms one part of the map; the complete map is created by drawing all the layers in the View, one after the other. Layers are often configured so that they only contain one particular type of features, e.g. roads or buildings. Layers can be individually turned on and off, either manually or automatically based on the scale of the view.
The DataSet is the representation of a set of geospatial data - e.g. on disk, in memory or in a database. You use different types of DataSets for different kinds of data, e.g. ShapefileDataSet, MemoryDataSet and SqlServerDataSet.
When the map is redrawn - usually because someone has interacted with the map, for example by panning or zooming in Carmenta Explorer (or other application) - geospatial information "flows" from right to left; from the DataSet to the View. Because of this, we often talk about the data flow model when we are referring to the structure in Figure 1.
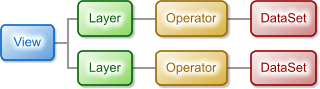
Figure 1 is actually a bit oversimplified. In between the Layer and the DataSet, there is always one or more Operators. Like this:
 |
Operators can perform many different operations on the geospatial features that flow past them. There are operators that restrict the flow of objects (e.g. FilterOperator), operators that transform the features (e.g. RectangleClipOperator) and operators that perform geospatial calculations (e.g. LineOfSightOperator).
Most Views will of course have more than one layer, like the view in figure 3:
 |
When the map is redrawn, the Layers in the View are painted one after the other in the order that they are attached to the view. This means that the layer that can be seen at the bottom of the figure above will be the topmost layer in the map presentation. (Yes, we know that this notation might seem a bit unintuitive at first.)
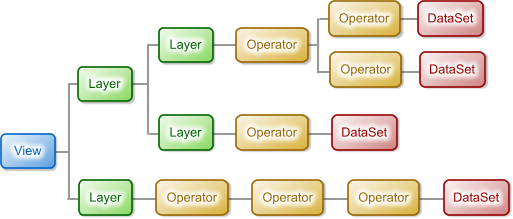
Real-world map configurations are of course usually more complex than the configuration in Figure 3. There are many reasons for this:
There are Layers (such as LayerSet) that can contain other layers, making it possible to create hierarchical structures.
Some Operators (such as PolygonClipOperator) have multiple inputs.
There can be any number of operators between the DataSet and the Layer.
The figure below is an example of a more complex map configuration.
 |
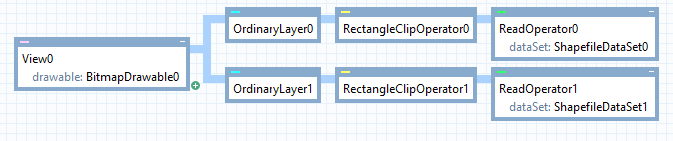
So far we have used a schematic presentation of the data flow model. When you work with the model in Carmenta Studio, it is visualized like this:
 |
Refer to the map configuration tutorial for more information about how to get started with Carmenta Studio.
Setting Up Visualization
In most cases the geospatial features that are read from a DataSet do not contain any information about how they should be visualized. (There are exceptions - image files, for example, have color information embedded and can thus be drawn directly.)
In order to specify how the features should be visualized you add a VisualizationOperator to the operator chain. You then connect one or more Visualizers to the VisualizationOperator. Like this:
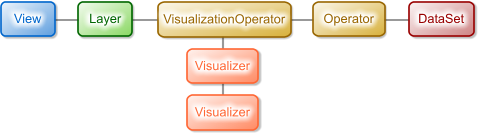 |
There are Visualizer subclasses for many different kinds of visualization, e.g.:
SymbolVisualizer is used to draw various types of Symbols.
TextVisualizer is used to draw texts and font symbols.
LineVisualizer is used to draw lines.
PolygonVisualizer is used to fill polygons.
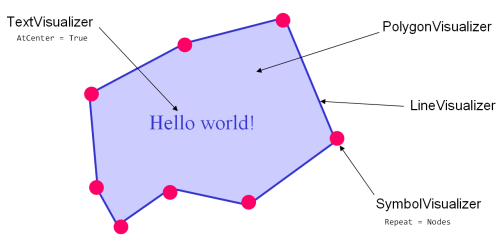
The Visualizers are very flexible - you can for example use a SymbolVisualizer to repeat a symbol along a line, or use a LineVisualizer to draw the outline of a polygon. It is very common to combine several Visualizers to create a composite visualization, like in the example below:
 |
Attribute Controlled Visualization
Very often the visualization of the features in a Layer should somehow be controlled by attributes of the geospatial features themselves. (Most, but not all, geospatial data formats have the ability to store such attributes for each geospatial feature.)
Some common examples of attribute controlled visualization:
In a layer containing cities, the text string that the TextVisualizer should display should come from a feature attribute called 'CITYNAME'.
In a layer which displays vehicle symbols, the rotation of the vehicle symbol should be determined by a feature attribute called 'DIRECTION'.
In a layer which displays land use polygons, features with the 'TYPE' attribute set to 'forest' should be green, but features with the 'TYPE' attribute set to 'cropland' should be yellow.
Carmenta Engine supports attribute controlled visualization through the use of attribute variables. All relevant Visualizer properties (and some Operator properties), such as TextVisualizer.Text and PolygonVisualizer.Color, are of attribute variable type, in this case AttributeVariable<System.String> and AttributeVariable<System.Drawing.Color> respectively.
Attribute variable properties can be specified in four different ways by using different subclasses:
Direct attribute variables are used to specify a constant value, i.e. a value that is not attribute controlled.
Indirect attribute variables are used to specify an 'indirect lookup', i.e. a value that comes from a feature attribute. This corresponds to the first two examples in the list above.
Expression attribute variables are used to calculate a value from feature attributes using Carmenta Engine's expression syntax.
Keyed attribute variables are used to specify a 'keyed lookup', i.e a value which is calculated using a look-up table with the feature attribute value as the key. This corresponds to the third example in the list above.
There is a complication with an indirect or expression attribute variable that should return a Font, Color or Symbol, since the value of the referred attribute cannot have such a type. This can be handled by referring to a string-valued attribute that contains a text representation of the font, color or symbol. For details, see TextVisualizer.Font, Encoding Colors in Strings and Encoding Symbols in Strings.
Carmenta Studio also provides an easy way to configure attribute controlled visualization. When you are editing a Visualizer property value, you can press the '...' button to open a dialog similar to the one in the figure below:
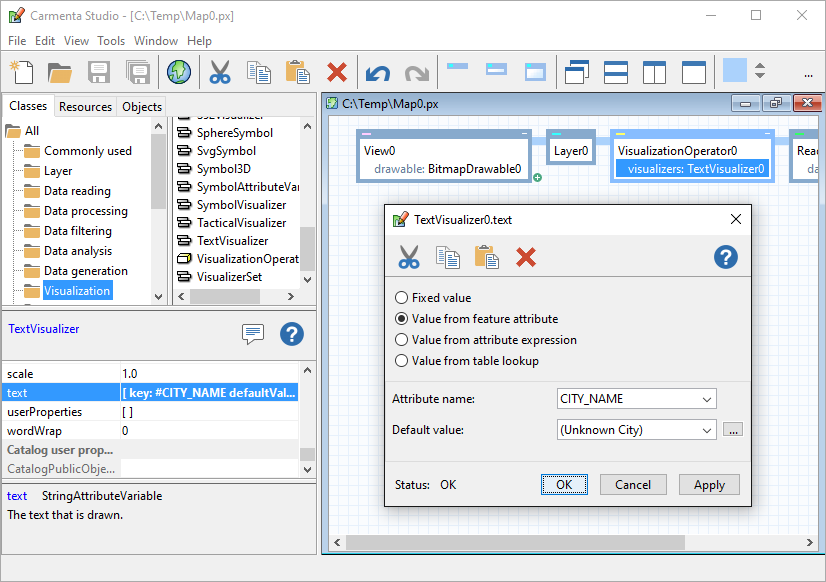 |
If you do not want to use Carmenta Studio to define your attribute variables, you can create or modify them by application code, see Attribute Variables in Code.
Other Noteworthy Objects
Geospatial Features
The Feature class is the Carmenta Engine representation of geospatial features; these are the objects that actually flow through the data flow model. Features have two important properties:
The Geometry property specifies the geographical position of the feature.
The Attributes property contains the attributes of the feature. (In the previous chapter we saw how to use these attributes to control the visualization.)
Coordinate Reference Systems
The Crs class is the Carmenta Engine representation of a coordinate reference system. The Crs is commonly specified in at least two different places in a map configuration:
The View.Crs property determines the coordinate reference system that the View should use for presentation.
The DataSet.Crs property is used to indicate what coordinate reference system the features in the dataset are stored in. (For many datasets Carmenta Engine can determine this automatically based on format metadata - refer to the documentation on the individual datasets for more information.)
If the coordinate reference system of a DataSet is different from that of the View, Carmenta Engine will automatically perform an on-the-fly reprojection of the features from the DataSet before they are drawn. See also When are things reprojected?
Where to Go Next
The sample map configuration files which are included in the Carmenta Engine SDK installation are a good source of inspiration for new users. It is possible to browse the different samples in Carmenta explorer. You can find more information about this in the map configurations samples document.