Working with Raster Data
Background maps are often raster maps, since these can usually be displayed more efficiently than vector maps. Raster maps can be classified into:
Image rasters (which consist of colors), and
Data rasters (which consist of numbers).
The numbers in a data raster may represent a physical quantity like elevation, or may represent thematic categories like WATER, FOREST or CITY. Carmenta Engine can interpolate between colors and between true numbers, but it makes no sense to interpolate between discrete integers that represent WATER or FOREST. To signal that interpolation is allowed, the continuous property - available on some datasets - should be True.
Image rasters
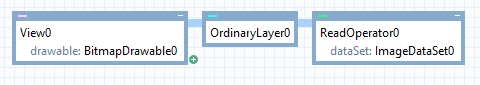
Some raster maps are images (like scanned paper maps or aerial photos) that can be displayed directly. Choose a DataSet that can read the data format, and attach it to a ReadOperator. The most common formats can be read by ImageDataSet or GdalDataSet, while other formats require other datasets. The ReadOperator will attach a simple RasterVisualizer to the data, so you do not need any VisualizationOperator:
 |
The default visualizer uses a nearest-neighbor filter, which can create a grainy display as you zoom out:
 |
To fix this, set the rasterFilter property of the dataset be Bicubic, which gives a smoother result:
 |
Numeric data rasters
Other raster data do not contain images, but raw numbers that needs an explicit visualizer. For example, elevation data in the form of numeric rasters can be displayed in many ways:
Hypsometric tints; that is, one color per elevation interval. Just use a VisualizationOperator and attach a RasterVisualizer with a suitable color table.
Relief shading. Generate it by a ShadeOperator, and use the default visualizer from the operator.
Contour lines. Generate them by a IsolineOperator, and use a VisualizationOperator with a LineVisualizer, and a TextVisualizer for line labels, where the TextVisualizer.Text should be an indirect attribute variable that returns the value attribute of each contour line. (To get any value attributes on the lines, you must also set IsolineOperator.LevelAttributeFormat to something else than the default None.)
A combination of the above (you can decrease the opacity of one or more layers).
In the configuration sample topographic_map.px, you find hypsometric tints in the layer ElevationColoring, you find relief shading in the layer Elevation_shade_transparent, and you find contour lines in the layer Topographic_contours_layer.
A common format for elevations is DTED. More information about this format is available in the article Working with DTED Data.
Thematic data rasters
Thematic data rasters contain integers that represent values in a discrete enumeration type. For example, in a thematic raster of terrain types we could have 0 representing Water, 1 representing Forest, 2 representing Grass, etc.
The meaning of the integers should appear in a raster attribute table that associates each integer with an AttributeSet; such a table can be used to generate a legend and in other ways. See Working with Raster Attribute Tables.
However, some thematic raster datasets are published without any machine-readable raster attribute table. In that case, you have to find out the meaning of the integers from other supporting documentation.
Overviews
Some raster data are stored in a single resolution, which means they are useful only in a narrow interval of map scales. To improve matters, you can of course try to get lower-resolution "overview" versions from your data provider.
If that is impossible, you can let raster datasets create their own low-resolution overviews of the data by specifying a raster cache policy. See for example ImageDataSet.RasterCachePolicy.
 |
 |
 |
 |
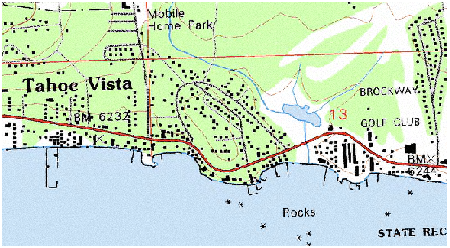
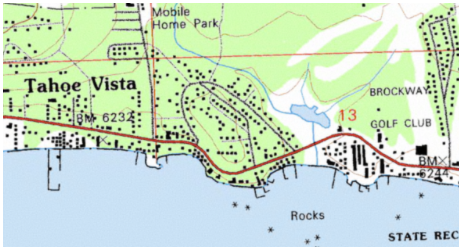
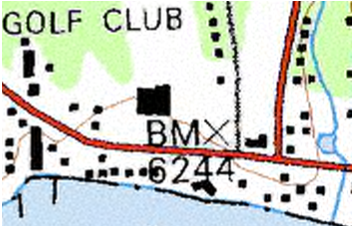
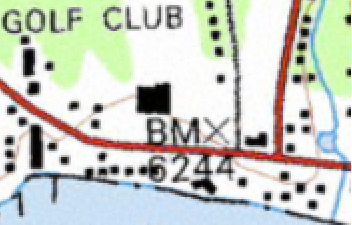
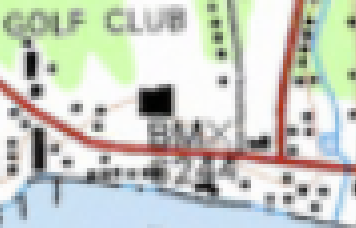
The images above show a scanned map together with three overview versions, which will be more efficient if the view is zoomed out. It is clear that such a scanned map cannot be zoomed out too much anyway, due to text size and symbol density, but for aerial photos and numeric rasters (like elevations) you can make good use of a large number of overviews.