Carmenta Explorer User's Guide
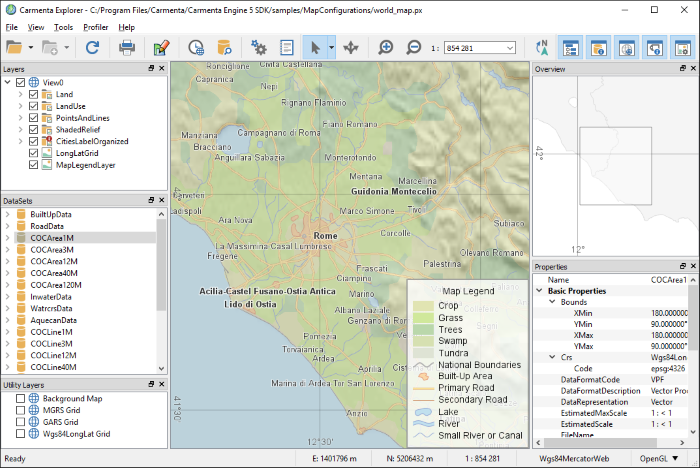
Carmenta Explorer is a map viewer. It is typically launched from within Carmenta Studio, by pressing the globe button or F5 on the keyboard, when working with a configuration. Carmenta Explorer is also installed as the default application for opening files with the .px extension. It is meant to help you with the following:
Visualize Carmenta Engine map configurations (.px files)
Visualize new sources of geographic data to help you create a suitable map configuration
Inspect features, layers and datasets to see their properties
Find configuration issues using the Log window and the Profiler
 |
To run the Linux version of Carmenta Explorer on Windows, using WSL, some packages located in the linux folder in the Carmenta Engine SDK directory, typically /mnt/c/Program Files/Carmenta Engine 5 SDK/linux, must be installed.
apt install ./carmenta-engine_*_amd64.deb ./carmenta-explorer_*_amd64.deb
Common Use Cases
I have a .px-file - How can I visualize it?
Click on  Open Map Configuration or press Ctrl + O. You can also drag and drop .px-files onto the window to open them. If you are working in Carmenta Studio you can press F5 or click on the globe icon in the toolbar.
I have received some geographic data and I don't know what it contains
Click the black triangle to expand the drop-down menu for "opening" choices.
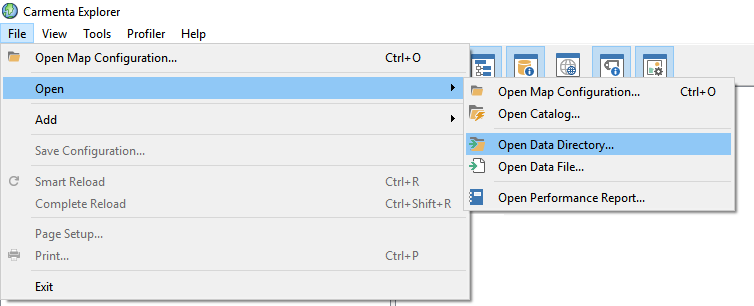 |
Then click  Open Data Directory... and select the folder containing the data. Carmenta Explorer will try to create a suitable map configuration to visualize the data. If you only want to add specific files, use
  Open Data File... instead. Use the DataSets panel or select features to see what attributes are set on the data. This is a good way to find out what attributes you can use to create specific visualization, e.g. "ROADTYPE" to visualize highways and normal roads differently. Please read more in Viewing data without a map configuration.
I do not see my data visualized at all
Right-click on the layer containing your visualization and select Zoom to Extent, to make sure that you are observing an area that is outside the extent of the data. If you still can not see anything, try zooming in further because your visualization could have a max scale set. If this did not help, there is probably an issue with either data reading or how the visualization is set up.
Open the
 Log window
Change Log level to All
Click the Clear button
Click
 Smart Reload
Look for error messages in the log. If the information does not help you isolate the problem, please contact support.
When testing my map configuration, the performance is slower than I had expected
First make sure that you have read the tutorials and any articles about your specific case under the Creating Map Configurations part of the documentation, such as Map Configuration Tutorials. If you still have problems, Carmenta Explorer can help you find out what parts of the configuration that take the most time using the  Profiler menu.
Layout
Carmenta Explorer consists of a number of dockable windows. It is possible to resize, reposition and hide them. Carmenta Explorer features a dockable window system where you can customize what windows are visible, their size and location. When you close Carmenta Explorer, the state of all dockable windows will be saved. You can access hidden windows using View → Windows.
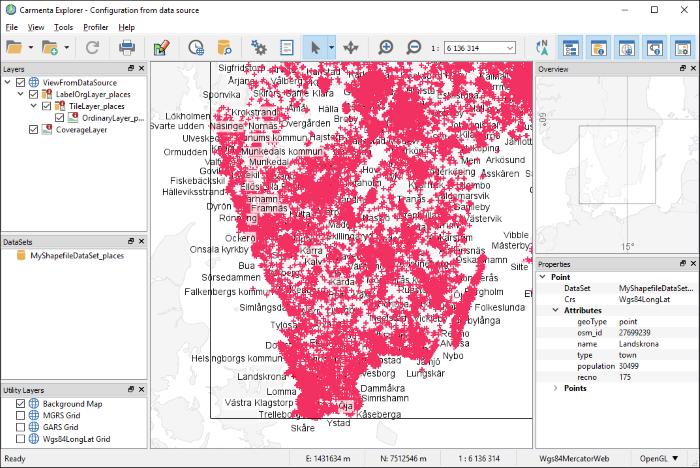
Main view window
This window renders the view assigned as Main view in the layer tree. When you open a map configuration with a view the main view will be set automatically. Interaction with the map can be altered by using the Toolbar.
Toolbar
The toolbar provides a number of buttons for quick access to common menu commands and tools for controlling the main view.
If your view or camera is rotated you can reset it by clicking  Reset camera bearing.
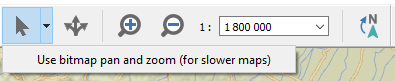
The standard tool is used for most operations, e.g. panning, zooming and selecting. See also the StandardTool. If you press and hold the StandardTool button, a menu will drop down, allowing you to enable bitmap pan and zoom for slower maps. More tool options can be modified in Options dialog on the Tools page.
 |
For 3D configurations you can select from three different tools to interact with the view:
The
 Standard 3D tool. Provides access to most aspects of the 3D view; zoom in or out on specific positions in the view; rotate around interesting positions; controlling the camera position, bearing and pitch.
The
 Free Navigation tool, that implements a flying carpet-like navigation where the camera floats free in the air.
The
 Flight tool, simulates flying an aircraft in the 3D view.
Status bar
The status bar displays information about mouse position, map scale and projection and the selected renderer.
The renderer field has a pop-up menu which lets to temporarily change the renderer used for the loaded configuration, without modifying the configuration file in Carmenta Studio. If you click the renderer field in the status bar and select one of the renderers in the menu, the main view will instantly change to the new renderer.
Layer tree
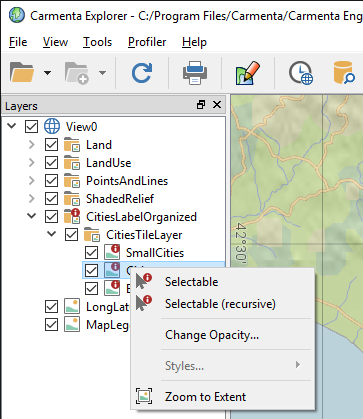
In the layer tree you can turn layers on or off by clicking the check boxes. You can also assign views to display in the main and overview windows by right-clicking the name and select from the context menu, see below:
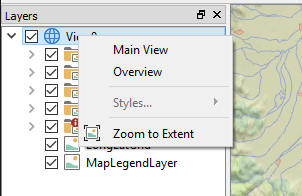 |
Right-clicking on a layer displays a layer specific context menu where you can toggle whether layers are selectable. You can also zoom to the area covered by data displayed by the layer.
 |
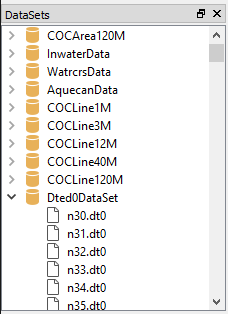
Datasets
The DataSets window shows the datasets that exist in the map configuration. If there are several views the datasets will be shown under the View in which they belong. When you select a dataset in the list, the Properties panel will be filled with information regarding the selected dataset. Some datasets will generate sub items in which case there is different information to be found in the Properties panel depending on what is selected in the DataSets panel.
 |
Utility Layers
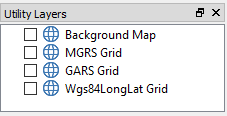
When looking at data in Carmenta Explorer these utility layers can help you see where the data is located. Note that they will only be visible in views that have a georeferenced Crs. When you close Carmenta Explorer, the enabled state of these layers will be saved.
Background Map - A simple background map that will be rendered behind the layers in the main view.
MGRS Grid - Military Grid Reference System, see Projected Coordinates.
GARS Grid - Global Area Reference System, see GarsGridGenerator.
Wgs84LongLat Grid - World Geodetic System 1984, see Crs.Wgs84LongLat.
 |
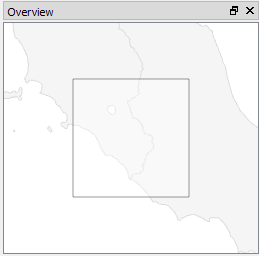
Overview window
This window shows the view assigned as Overview in the layer tree. If no overview has been set, a default overview using the background map and Wgs84LongLat grid from the Utility Layers is created. The Crs of the default overview is Crs.Wgs84MercatorWeb.
 |
Properties
Some parts of Carmenta Explorer have selectable items. This window shows you information about them in the form of a list with two columns. For each entry you can copy the name and value to the clipboard by right-clicking and opening the context menu.
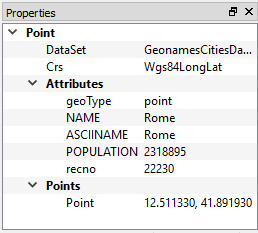 |
Selection in Main View
When you click on features in the map window they get selected and their geometry points and attributes are shown as text in the properties window.
To be able to select features in the map, the layers need to be marked as selectable. This is set up in the map configuration, but you can override it temporarily using the context menu when right-clicking on a layer in the Layers window.
Selection in Layers
Views and layers can be selected. This is where you can see the maximum and minimum scales that turn off visualization based on scale.
Selection in DataSets
Datasets and any sub-items can be selected. Some datasets will show the attributes that features in the dataset have. For Shapefile datasets, a convenient option is to select all features that have a certain attribute value. The view will zoom to the extent of the selected features making it easy for you to see where they are.
Menu bar
File menu
From the File menu you can select file operations such as open configurations, reload the current configuration, etc.
The Open Map Configuration command is used to open and display an existing map configuration file.
The Show Map Configuration Samples command opens up a browser from which you can explore and load the different map configuration samples included in the Carmenta Engine SDK installation. More information about the samples can be found in the documentation for map configurations samples.
The  Open Catalog command is used to open and display maps in a catalog. More information about the benefits of publishing maps
through a catalog and how to do it can be found in the Catalog Mechanism Overview.
Open Catalog command is used to open and display maps in a catalog. More information about the benefits of publishing maps
through a catalog and how to do it can be found in the Catalog Mechanism Overview.
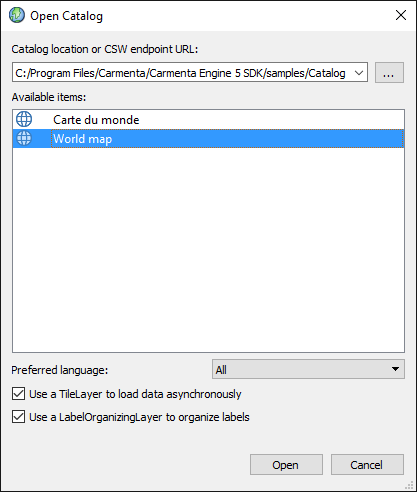 |
After entering the path to a local catalog on disk or the endpoint URL of a remote OGC CSW service the dialog will be populated with the list of available maps that you can open in Carmenta Explorer. This operation can take a while if you are connecting to a remote OGC CSW service.
The Open Data Directory command is used to open a folder with data sources without having a map configuration to start with. Can be done by drag & dropping a directory on the application.
The Open Data File command is used to open a data source without having a map configuration to start with. Can be done by drag & dropping a file on the application.
The  Add Data Directory command is used to add a folder of data sources when you have previously opened a data source. Can be done by drag & dropping a directory on the application.
The  Add Data File command is used to add a data source when you have previously opened a data source. Can be done by drag & dropping a file on the application.
The Open Performance Report command is used to open and display a performance report that has been saved by either Carmenta Explorer or a Carmenta Engine application. You can also profile maps rendered by an application, see the documentation for the Profiler menu class for more information.
The Save Configuration command is used when you have opened a data source and want to save the generated map configuration. When saved, Carmenta Explorer will load the saved file as a normal map configuration.
The Smart Reload command reloads the configuration but keeps the view at the same position and scale. The enabled state of each layer is also kept the same.
The Complete Reload command resets all layers and view parameters to the values from the configuration.
The Export to GeoPackage command allows you to export a portion of a map into a standalone OGC GeoPackage. Please see GeoPackage overview for more information about GeoPackage files and how to use them.
The Page Setup and  Print commands can be used to configure and print a map.
View menu
The View menu provides options to turn on or off the toolbar, status bar and the dockable windows. You can also open the Log window, see further the separate section below, from the View menu.
The format used for displaying the mouse position on the status bar can be selected from the View menu.
Tools menu
The Tools menu provides a shortcut for opening  Carmenta Studio. If a configuration is loaded in Carmenta Explorer,
the name of the configuration file will also be passed to Carmenta Studio, which will open it for editing.
Carmenta Studio. If a configuration is loaded in Carmenta Explorer,
the name of the configuration file will also be passed to Carmenta Studio, which will open it for editing.
The Send view area to Carmenta Studio command also sends the configuration file to Carmenta Studio. In addition, it passes the current view area (or camera parameters if it is a 3D configuration). Carmenta Studio will open the file for editing, and update the view parameters accordingly in the configuration. You can then choose to save the changes or to discard them.
The  Find features... command opens a dialog that lets you search for features in datasets that
have a search index.
Find features... command opens a dialog that lets you search for features in datasets that
have a search index.
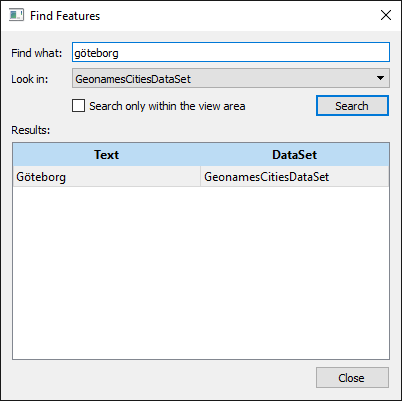 |
The text to search for is specified in the Find what field. Look in can be used to limit a search operation to a specific dataset. Search only within the view area limits the search to the current view area. You can zoom to a feature in the result by double clicking on it in the Results list or by selecting it the list and then pressing Enter.
The Change Opacity... command opens a small window where you can control the opacity value of the currently selected layer.
The Run performance test command will run a short performance test. It will repeatedly redraw the view as many times as possible during a ten second interval, and afterwards report the average FPS (frames per seconds). Note that in a configuration where the visualization is cached by a TileLayer, this will only test the rendering speed, and not how fast the TileLayer loads the tiles.
The Wireframe command will display a 3D map as a wireframe model. It is only available for 3D maps.
The Display statistics command will display 3D rendering details; frames per second, triangle count and texture size; overlaid on the map. It is only available for 3D maps.
The List extensions used... command will display all of the Carmenta Engine extensions that have been used since Carmenta Explorer was started this time. It is a useful way to find out what extensions are used in samples that are loaded with Carmenta Explorer. Note that if you open a configuration and it uses extensions, that extension will still be listed when you look at other configurations in this Carmenta Explorer instance.
The  Options command opens a dialog for setting options for controlling data set initialization, the global cache size,
printing and tools.
Options command opens a dialog for setting options for controlling data set initialization, the global cache size,
printing and tools.
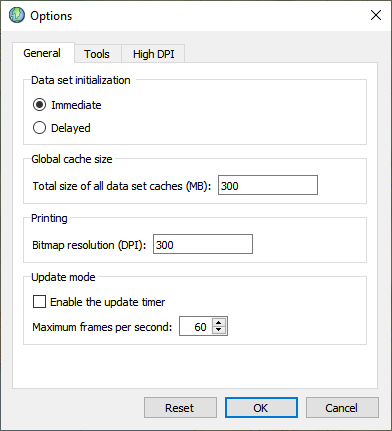 |
The Data set initialization specifies whether you want Carmenta Explorer to initialize and index all data sets immediately when a map configuration is loaded or if you want to delay it until a data set is actually used. More information can be found in the documentation for data set initialization.
The Global cache size specifies how many megabytes of RAM Carmenta Engine will use to cache data in data sets. More information can be found in the documentation for the global cache.
In the Printing section, the resolution field specifies at which resolution a map is rasterized when printed. A higher value might give better printing quality, but will require more memory and take longer to print.
The Maximum frames per second specifies an upper bound on how often a 3D map will be rendered. If the Enable the update timer checkbox is checked, Carmenta Explorer uses a timer to try and update that many times per second. If unchecked, the map will only be updated when needed, but never more often than the number set. This mode is the default and is recommended. You can read more about how to control the view updates in your own application by reading here: IMapControl.UpdateMode
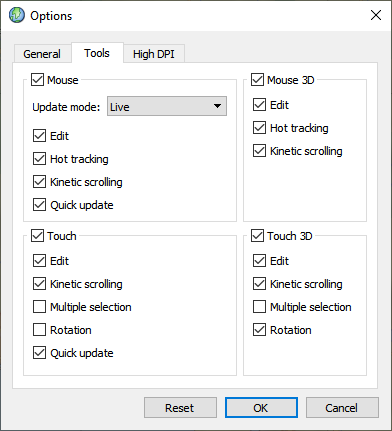 |
Options in the Standard tool section can be used to enable or disable specific interactions provided by the built-in standard tool. You can also disable the standard tool completely. There are separate settings for the combinations of mousetouch and 2D3D. The tools are: StandardTool, StandardTool3D, StandardTouchTool, and StandardTouchTool3D.
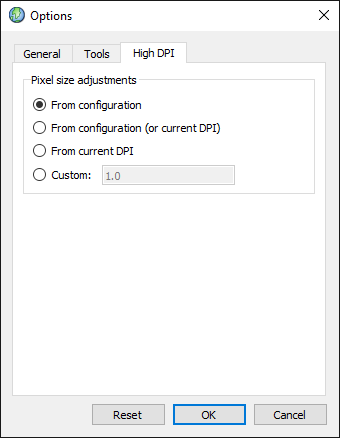 |
Options in the Pixel size adjustments section can be used to adjust the visualization in Carmenta Explorer for a high DPI screen.
The default setting From configuration uses pixel size adjustments specified in the map configuration. From configuration (or current DPI) uses pixel size adjustments in the map configuration if any have been specified, otherwise it adjusts the visualization for the current DPI of the primary screen. From current DPI always adjustments and adjusts the visualization for the current DPI of the primary screen.
You can specify pixel size adjustments for specific types of graphics, for example lines or texts, in the .px-file by adding a PixelSizeAdjustments object to a Drawable.
Profiler menu
Provides commands to investigate the performance profile on the layer level of the configuration, see the Profiler section below for more information.
Help menu
Provides access to the Carmenta Studio documentation. About will show you the Carmenta Engine version this Carmenta Explorer is using.
Advanced Features
Viewing data without a map configuration
It is possible to automatically create a view for most data types. This is done by opening a data source instead of a map configuration file.
|
|
You can use either Open Data Directory... or Open Data File...
The main purpose of this function is to quickly find out what kind of geographic data the data source contains and what attributes it has. Visualization is created based on geometry type, and if certain attributes that are known to be text exist, a TextVisualizer will be created. The created map configuration can be saved and used as a starting point from which you can create your complete configuration. When saved, Carmenta Explorer will reload the map configuration as a .px file.
When a configuration is created by opening a data source, the DataSets window will be populated with the datasets used to read the data sources. This means that datasets can be selected and the Properties window will show the attributes of the selected dataset.
After a data source is opened, it is possible to add additional data sources using the File → Add → Add Data Directory... and File → Add → Add Data File... commands.
It is possible to drag & drop files and folder on Carmenta Explorer. If no configuration, or a configuration from a PX-file is currently loaded, a drag & drop operation of files and folder will result in creating a new configuration where dragged folder and files will be added as separate layers, containing each of their data sources as layers. If a configuration map created in this way is loaded, a drag & drop operation will continue to add data sources as separate layers into the existing view.
You can only add additional data sources when the configuration was created from a data source and has not been saved as a .px-file.
The result of this function focuses on being useful when observing the data temporarily. In most cases this will not be the most optimized way of using your data. Here are some notes about what you should take a look at if you decide on saving the created configuration and work from there:
All generated layers will be set to being selectable. This can affect performance heavily based on the data. It is essential that you turn off selection for all layers that do not need it.
Remove the visualizers that you do not need. TextVisualizers are usually not needed on all vector based data.
Each time you open or add data sources, the program will consider the data sources added as a group. One tile layer containing the layers is created. You may want to group together more layers in the same TileLayer, or you may want to divide them into more. Consider that if you do not have any reason to show something in a tile before all of the data in that tile has been loaded, you are better off with only one TileLayer that contains all the layers. In general, put background layers in one TileLayer and foreground layers in another TileLayer.
A LabelOrganizingLayer will be added on top of the TileLayer so that the visualized texts are not all ending up on top of each other. The layer is completely unnecessary if no texts should be visualized.
The maximum and minimum scales are calculated based on the bounds and size of the data. It is there to limit the risk of the computer using too much memory, but also to get a map that is not too slow. The scale limits should be revised so that they accurately match your needs.
The names of created layers are generated and in most cases a suitable name can be created based on what type of layer it is and how the data files are named. You may want to rename the layers once you are happy with the layout of your map configuration.
Some data sources are non georeferenced. These will be added to a separate view that can be switched to by right clicking on the view and selecting it as the main view.
 |
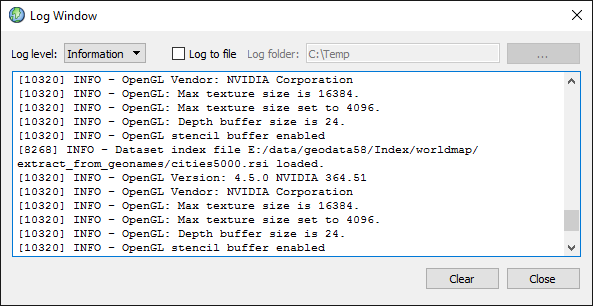
Log window
The Log window is shown by clicking the button in the toolbar
or selecting the Log window command in the View menu. The Log window shows log messages generated by
Carmenta Engine. You can both look at the log messages directly and save them to a file on disk.
An application can activate the log programmatically through the Log class.
 |
Profiler
The Profiler measures execution time and number of calls to components of a configuration, e.g. layers, views and
operators. You start a profiling session by clicking the
button in the tool bar or selecting the Start command in the Profiler menu. Carmenta Explorer will collect
statistics until you click the button again or until you select the Stop command in the Profiler menu.
A comprehensive statistics report is saved in a file that can be opened from the File menu, see the figure below which shows a performance report for the topographic_map.px sample:
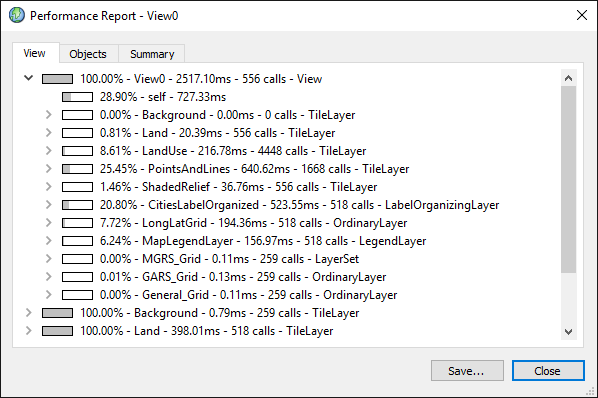 |
The root items in the report represent work performed by different threads. The first item always contains performance data collected for the GUI thread when it draws a map. Other root items, if any exist, contain performance data collected for the work that each TileLayer or TileLayer3D instance performs on a background thread: loading data, processing it in operators and generating the visualization (but not drawing it).
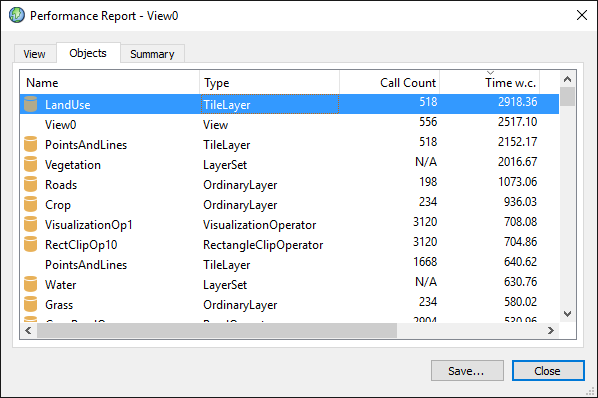 |
The Objects tab displays the same items as the View tree but in a flat list. The list can be sorted according to each column which can make it easier to find a particular object and you can double click on an item to find it in the View tree.
The different columns contain:
- Name
The name of the object as specified in a Carmenta Engine map configuration.
NoteA small database icon in front of the object name in the list indicates that the item represents work performed by a background thread.
- Type
What kind of Carmenta Engine object the item represents.
- Count
The number of times that the object has been called during the profiling session. This column is sometimes N/A which indicates that the object has not been called but is used to group other child objects in the View tree.
This value can be misleading since it will also include calls made when features are selected, deselected or if the application uses hot tracking and the mouse is moved during profiling.
- Time w.c.
Time with children specifies the time spent in the object and all its child objects (i.e. any child layers, operators and datasets used by the object).
This value is also displayed in the View tree. For example, in the image above we can see the GUI thread spends approximately 2.7s updating the mainView.
- Average Time w.c.
Average time with children specifies the average time spent in the object and all its child objects in a single call.
- Time
The total amount of time spent in the object but not in its child objects.
- Average Time
The average time spent in the object, but not in its child objects, during a single call.
See also the Profiler documentation.