DensityDataSet Class
Produces a smoothed density heatmap from a source dataset of point features.
NuGet/Assembly: Carmenta.Engine.5.17.0.nupkg (in the CEDataSets assembly)
Syntax
public class DensityDataSet : DataSetRemarks
There is a map configuration sample density_heatmap.px that demonstrates how DensityDataSet can be used to create density heatmaps.
A DensityDataSet can be used to calculate the density of a source dataset of point features. This is useful when the point dataset is so large that displaying each point feature as a symbol would be cluttered and inefficient.
Introduction
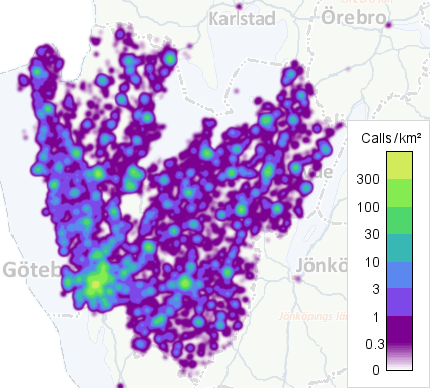
Here are some example screenshots, using a point dataset of about 117 000 locations of emergencies that were handled by a regional call center during half a year.
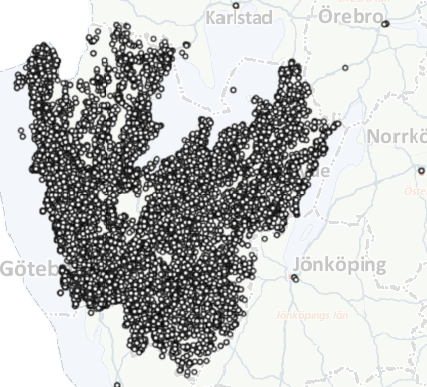 |
Drawing all these circles is inefficient, and the result is not very useful since they obscure each other. (The appearance can become somewhat better with a smaller and semitransparent symbol; see the screenshot at DensityQuery.)
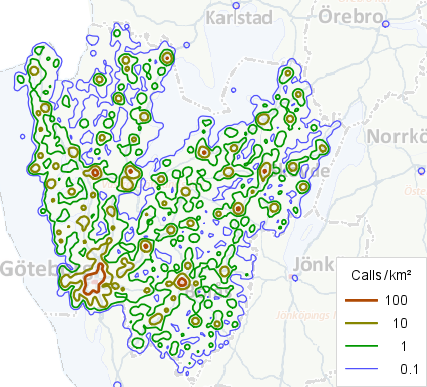
Let us use this point dataset as the source DataSet of a DensityDataSet instead.
 |
 |
Of course, if you zoom in enough, the map window will contain only a few point features, and it will make more sense to display individual point symbols rather than density. So your density layer should have a specified Layer.MinScale, and be complemented with a point symbol layer with a specified Layer.MaxScale. Note that you can have a scale interval where both layers are active.
Density and Weights
The density dataset keeps a reference to the source dataset of points, and will produce Float rasters where each cell contains a local density: an estimate of the number of points per square kilometer. More generally, the density dataset can calculate a FeatureWeight from attributes for each point feature; then the density in a raster cell will be an estimate of the total weight per square kilometer. For example, in a point dataset of fatal accidents, the feature weight could be the number of casualties in each accident.
Negative feature weights are permitted. For example, if the weights represent wealth, negative weights could represent debts. However, the autogenerated raster visualizer (see paragraph below) cannot handle negative densities, so you must design your own visualization.
The FeatureWeight cannot be changed after the dataset has been initialized.
Filtering
There are two ways to filter the source dataset. The most efficient way is to use a source Query to do the filtering. For example, if the source dataset is a Shapefile, you can filter by using a ShapefileQuery.Condition. But sometimes the type of Query that can be used for the source dataset is not expressive enough: then you can define a FeatureCondition instead.
The source Query and the FeatureCondition cannot be changed after the DensityDataSet has been initialized.
If the source dataset contains a mixture of geometry types, there is no need to filter away the non-point features explicitly, because a DensityDataSet will ignore them automatically.
Smoothing the Density
To calculate the density value of each raster cell, the statistical smoothing method known as kernel density estimation is used. The amount of smoothing is controlled by a kernel bandwidth parameter, which is not a property of DensityDataSet but which can be specified as DensityQuery.Blur. It is not trivial to choose the blur value, and we suggest that you just try different blur values until the map looks good, subjectively. For further discussion and some screenshots, see DensityQuery.
Indexing
When initialized, a DensityDataSet generates a hierarchical spatial index from the source dataset, designed so that density rasters can be calculated efficiently in all scales. The memory requirement for the index is usually less than 5 bytes per point if the FeatureWeight is constant, and less than 9 bytes per point otherwise.
Using a dynamic source dataset
The spatial index can be erased by calling the FlushCache method. This can be useful if the source DataSet is a MemoryDataSet that can be modified by the application: each modification will invalidate the index, so FlushCache should be called before the next update. Note that this does not happen automatically - it is the responsibility of the application. When the index has been erased, it will be regenerated automatically the next time it is needed. Of course, regenerating the index can take some time, but this approach should be feasible if the MemoryDataSet does not contain too many points and is not modified too often.
If the DensityDataSet is used under a TileLayer (which is recommended), you will also need to call the OrdinaryLayer.FlushCache method.
If you use this dynamic approach, note that you must design your own visualization instead of relying on the autogenerated one (see below), because the autogenerated color table can change if the spatial index is modified.
Autogenerated Raster Visualizer
The density rasters have an autogenerated raster visualizer, which usually works pretty well if your FeatureWeight is never negative. This makes it easy to get started, since you do not need to worry about visualization at first. When you are ready to use your own raster visualizer instead, you can just attach it to a VisualizationOperator as usual, using VisualizationOperator.Mode = Replace. Alternatively, you could use an IsolineOperator to generate isodensity lines, as shown in the screenshot above: isolines can give nearly as much information as a colored raster, while hiding less of the background.
The autogenerated raster visualizer is described below. Even if you plan to design your own, you may want to reuse some design principles from the autogenerated one.
The major design problem is to determine a suitable range of density values for the color table, since you often do not know the typical density values in the rasters. (Would you know how many emergency calls are made per square kilometer in a year?) In the autogenerated visualizer, the maximal value in the color table is determined during the dataset indexing. Using the spatial index, a set of non-zero density values are computed in all resolutions, without smoothing, based only on raster cells that contain at least 100 points. From this set, the 98th percentile is used as the maximal value in the color table. (It turns out that the 100th percentile would not work well, because there are often some extreme hotspots with density values several orders of magnitudes larger than the rest, and because the smoothing will lower the peak densities.)
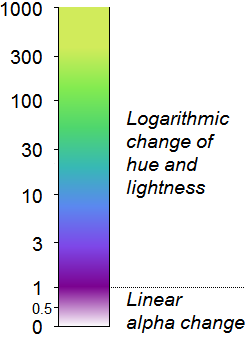
When the maximal value has been determined, the autogenerated color table is constructed from two parts:
An upper part, which is a logarithmic opaque color table spanning three orders of magnitude; that is, from 0.001 * max to max.
A lower part, which is a color table with constant color but a linear change in opacity, going from 0 to 0.001 * max.
If the max color value happens to be 1000/km², the autogenerated visualizer would look like this:
 |
The opaque color scheme in the upper part uses Matteo Niccoli's perceptual rainbow palette.
M. Niccoli and S. Lynch. A more perceptual color palette for structure maps, CSEG/CSPG 2012 convention, Calgary. See also the MyCarta blog post, Perceptual rainbow palette – the method.
We have adapted it to a logarithmic scale since density values often span many orders of magnitude, and it is usually more important to see the difference between 50 and 150 (they differ by a factor of 3) than to see the difference between 850 and 950 (the differ only by a factor of 1.12).
However, a problem with a logarithmic scale is that the zero value is infinitely far away. So, to be able to reach zero gracefully, in the lower part we keep the darkest color of the opaque rainbow palette, but we change its alpha value linearly from fully opaque to fully transparent. This design softens the transition from sparse data to no data, and works well on a background map of light colors.
Available Resolutions
A DensityDataSet can generate density rasters in a set of fixed resolutions. The resolution for each request is of course chosen to fit the view scale and the Query.ResolutionFactor of the DensityQuery. The different levels of resolution differ by a factor of 2, and if the CRS uses a true map projection (not LongLat), the resolutions are designed to fit the scale levels
..., 1 : 5 000, 1 : 10 000, 1 : 20 000, 1 : 40 000, 1 : 80 000, ...
assuming a screen resolution of 96 dots per inch. This corresponds to the resolutions
..., 1.323 m, 2.646 m, 5.292 m, 10.583 m, 21.167 m, ... (nominal meters).
However, the available range of resolution levels will depend on the extent of the point dataset, since only 21 levels of resolutions will be available. Level 0 will give a raster of a single cell covering the points, level 1 will give a raster of 2 by 2 cells covering the points, level 2 will give a raster of 4 by 4 cells, etc., until level 20 corresponds to a raster of 2^20 by 2^20 cells, that is 1 048 576 by 1 048 576 cells.
For example, if the point dataset covers mainland France, and a meter-based CRS like RGF93 / Lambert-93 is used by the DensityDataSet, then we can calculate that the points fit in a square with a side of 960 km. So the finest available density resolution must then be at least 960 km / 1 048 576 = 0.916 m, and since the resolutions are chosen from the series above, it will actually be 1.323 m.
For a point dataset with very large or global extent, you should choose a LongLat-based CRS for the DensityDataSet (see next paragraph). The set of fixed raster resolutions will then be such that a raster cell height will be one degree divided by a power of 2, for example 1/32 degree, while the corresponding cell width will be 1.5 times as large. If the data extent is global, the finest available resolution will have a cell height of 1/4096 degrees and cell width of 1.5/4096 degrees, which corresponds to a cell height of about 27 m and a cell width of about 41 m near the equator.
Choosing a CRS
The density index is designed to produce density rasters expressed in the CRS of the DensityDataSet, and the choice of CRS can affect the quality and performance. The recommended CRS depends on the extent of the point dataset.
However, the default CRS, Crs.Wgs84LongLat, is always a valid choice. This may be surprising since LongLat, when used as a flat map projection, has severe distortions far from the equator. However, the DensityDataSet knows about the LongLat distortions and compensates for them.
But this choice will require raster reprojection later, since the CRS of the View is usually not based on LongLat. If the extent of the point dataset is small compared to the Earth, you can improve performance by using the same CRS for the density rasters as for the View. If this CRS is chosen sensibly for the area of interest, and the area is not too large, then the inaccuracies caused by map projection distortions should be small. (The DensityDataSet compensates for distortions only with LongLat.)
Summary of CRS advice
For 2D maps:
For a global area of interest, use an equal-area CRS for the View, but use Crs.Wgs84LongLat for the CRS of the DensityDataSet.
For a non-global area of interest, use the same projected CRS for both the View and the DensityDataSet:
If the area of interest is larger than a medium-sized country, use an equal-area CRS.
Within a small or medium-sized country, you should be able to use a national CRS that has small map projection distortions within the country, even if the CRS is not technically equal-area.
If the density map is displayed in a GlobeView, use Crs.Wgs84LongLat for the CRS of the DensityDataSet.
More about choosing CRS for 2D maps
Since density is defined as something per area unit, one can argue that the View should use a map projection that is equal-area, so that area distortion will not cause the density map to be misleading. However, if the area of interest is small enough, a map projection that is not technically equal-area can be sufficiently equal-area for practical purposes. For example, the national CRS for France, RGF93 / Lambert-93, uses a map projection that is conformal instead of equal-area, but the area distortion within mainland France is less than 0.4 percent, so it is not a problem. So a national CRS for a small or medium-sized country will often work well in practice, both for display and for calculations.
For a larger area of interest, it can be better to construct a truly equal-area CRS. For some large areas, there is already an official recommended equal-area CRS, for example:
Code | Name | Area of Use |
|---|---|---|
epsg:3035 | ETRS89 / LAEA Europe | Europe except Iceland, Russia, Belarus, Ukraine and Moldova. |
epsg:5070 | NAD83 / Conus Albers | The contiguous United States (USA except Alaska and Hawaii) |
epsg:6931 | WGS 84 / NSIDC EASE-Grid 2.0 North | Northern hemisphere |
The search interface at https://epsg.org does not allow you to restrict the search to equal-area CRS instances, but you can find most of these by writing either LAEA, Albers or EASE in the Name field. If you do not find a suitable equal-area CRS in the EPSG database, you can construct your own by using an equal-area map projection like AzimuthalEqualAreaProjection or AlbersEqualAreaConicProjection.
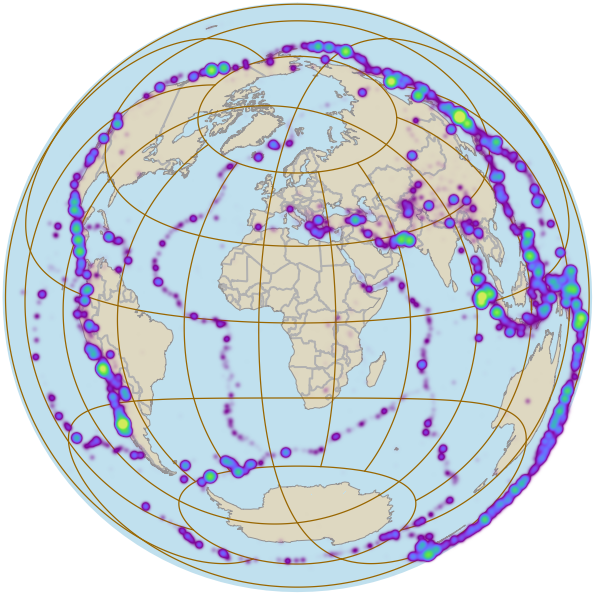
But an equal-area projection will not give perfect results. It is true that the basic density values will be free of map projection errors, since the area of each raster cell will be correct when calculated via the projected coordinates. However, the smoothing procedure should smear out the contributions from each data point equally far in all directions, and this will be compromised by map projection errors, since the local linear scale varies with the direction from a point on an equal-area map. That is, the smoothing will go equally far in all directions if measured in nominal projected meters or in screen pixels, but not if measured in true meters.
As an example, we show earthquake density that is both calculated and displayed in an AzimuthalEqualAreaProjection. The smoothed blobs look circular everywhere, but near the map edges such circles do not correspond to true circles on the ground, and some blobs in the lower right extend past the map boundary.
 |
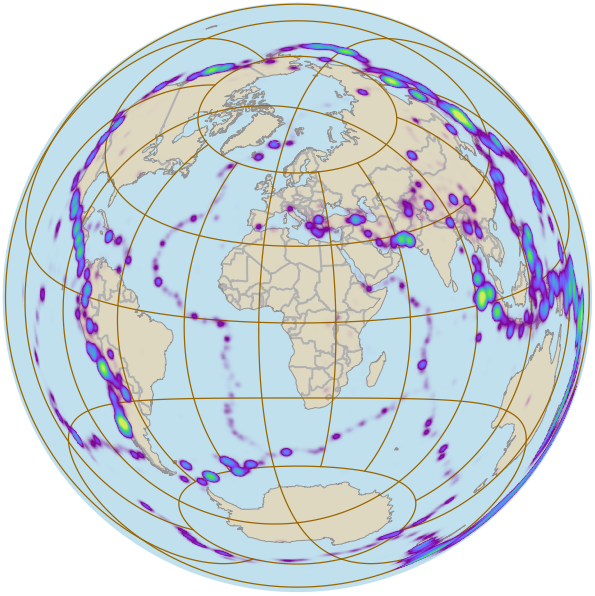
Therefore, if the area of interest covers the whole world, it is still a good idea to use an equal-area CRS for the View, but for the CRS of the DensityDataSet it can be better to use WGS84 / LongLat. This is because the DensityDataSet knows about the LongLat distortions, as mentioned earlier: it knows that a degree of longitude is shorter at higher latitudes, and will compensate for that when calculating the density raster. However, the polar areas have too large LongLat distortions, so density rasters are generated in LongLat only between 72°30'S and 72°30'N, and elsewhere they are generated in two CRS instances that use polar map projections.
Here is the earthquake density again, calculated in LongLat:
 |
When LongLat is used, the density calculation can usually be smoothed seamlessly across the dateline (meridian 180°) and across the 72°30' parallels, but there are some minor limitations:
The density contributions from a point with latitude less than 70° or greater than 75° cannot be smoothed across the 72°30' parallel.
The density contributions from a point farther than 12 longitude degrees from the dateline, and with a latitude between 72°30'S and 72°30'N, cannot be smoothed across the dateline.
If a faint seam is visible along the 72°30' parallel, it can usually be removed by inserting a RasterMergeOperator in the operator chain.
Inheritance Hierarchy
System.Object
EngineObject
ResourceObject
DataSet
DensityDataSet
Platforms
Windows, Linux, Android
DensityDataSet Members
The DensityDataSet type has the following members.
Constructors
| Name | Description |
|---|---|
| DensityDataSet | Embeds a source dataset of points into a new instance of the DensityDataSet class. |
Properties
| Name | Description |
|---|---|
| Crs | Gets or sets the coordinate reference system of the DensityDataSet. Inherited from DataSet |
| DataSet | Gets or sets the source dataset of points; can only be set before initialization. |
| Description | Gets or sets a short description of the dataset. Inherited from DataSet |
| DisplayName | Gets or sets a display name for the dataset. Inherited from DataSet |
| FeatureCondition | Gets or sets a filtering condition for the features; can only be set before initialization. |
| FeatureWeight | Gets or sets the weight of each feature; can only be set before initialization. |
| Id | Gets a unique identifier for this dataset instance. Inherited from DataSet |
| IsDisposed | Gets a value that tells whether the current DensityDataSet has been disposed. Inherited from EngineObject |
| IsoMetadataDocument | Gets or sets the path to an ISO 19139 metadata document for the dataset. Inherited from DataSet |
| Name | Gets or sets the name of the DensityDataSet. Inherited from ResourceObject |
| NativeHandle | Gets the native Carmenta Engine kernel object the current DensityDataSet represents. Inherited from EngineObject |
| Query | Gets or sets the source query used when retrieving data from the source DataSet; can only be set before initialization. |
| SuppressInitializationErrors | Gets or sets a flag indicating how errors during dataset initialization are handled. Inherited from DataSet |
| IUserProperties.UserProperties | Gets the AttributeSet that contains the user properties. Inherited from IUserProperties |
Methods
| Name | Description |
|---|---|
| Clone | Creates a copy of an object. Inherited from EngineObject |
| Dispose | Releases the reference to the native Carmenta Engine kernel instance the EngineObject represents. Inherited from EngineObject |
| Equals | Determines whether this instance is equal to another. Inherited from EngineObject |
| FindChildObject | Overloaded. Finds the child object with the specified name. Inherited from DataSet |
| FlushCache | Frees any information the dataset may have cached, including all cached features. Inherited from DataSet |
| GetChildObjects | Overloaded. Gets the child objects of the current object. Inherited from DataSet |
| GetDataCoverage | Gets coverage information for this dataset in a given area. Inherited from DataSet |
| Looks up an existing dataset instance from a dataset identity. Inherited from DataSet | |
| GetDataSetInfo | Returns a dataset info that describes the contents of this dataset. Inherited from DataSet |
| GetDataSetInfoAsync | Makes an asynchronous call to GetDataSetInfo. Inherited from DataSet |
| GetFeature | Gets the feature with the specified identity. Inherited from DataSet |
| GetFeatures | Overloaded. Gets features from the dataset. Inherited from DataSet |
| GetFloatValueAt | Overloaded. Gets the float raster value from a cell at the specified position. Inherited from DataSet |
| GetFloatValuesAt | Overloaded. Gets a number of float raster values. Inherited from DataSet |
| GetLocalizedDescription | Gets a localized version of the dataset description in a specific language. Inherited from DataSet |
| GetLocalizedDisplayName | Gets a localized version of the dataset display name in a specific language. Inherited from DataSet |
| GetLocalizedIsoMetadataDocument | Gets the path to an ISO 19139 metadata document for a specific language. Inherited from DataSet |
| GetNormalizedFloatValueAt | Overloaded. Gets the raster value from a cell at the specified position, normalized by Scale and Offset. Inherited from DataSet |
| GetNormalizedFloatValuesAt | Overloaded. Gets a number of raster values, normalized by Scale and Offset. Inherited from DataSet |
| GetValueAt | Overloaded. Gets the integer value from a raster cell at the specified position. Inherited from DataSet |
| GetValuesAt | Overloaded. Gets a number of raster values. Inherited from DataSet |
| HasLocalizedDescription | Checks if a localized version of the dataset description is available in a specific language. Inherited from DataSet |
| HasLocalizedDisplayName | Checks if a localized version of the dataset display name is available in a specific language. Inherited from DataSet |
| HasLocalizedIsoMetadataDocument | Checks if an ISO 19139 metadata document is available for a specific language. Inherited from DataSet |
| HighestRasterValue | Finds the highest raster value inside the given polygon. Inherited from DataSet |
| Initialize | Initializes the dataset. Inherited from DataSet |
| SetLocalizedDescription | Sets a dataset description in a specific language. Inherited from DataSet |
| SetLocalizedDisplayName | Sets a dataset display name in a specific language. Inherited from DataSet |
| SetLocalizedIsoMetadataDocument | Sets the path to an ISO 19139 metadata document for the dataset, for a specific language. Inherited from DataSet |
| TryGetFloatValueAt | Overloaded. Gets the float value from a raster cell at the specified position. Inherited from DataSet |
| TryGetNormalizedFloatValueAt | Overloaded. Gets the float value from a raster cell at the specified position, normalized by Scale and Offset. Inherited from DataSet |
| TryGetValueAt | Overloaded. Gets the integer value from a raster cell at the specified position. Inherited from DataSet |