IsolineOperator.OutputType Property
Gets or sets a value that decides the output type: either lines or some kind of polygons.
Syntax
public IsolineOperatorOutputType OutputType { get; set; }Property Value
Default: Lines
A value that decides the output type: either lines or some kind of polygons.
Remarks
The possible values are
Lines
AdjacentPolygons
OverlappingPolygons
VolumePolygons
We will use these names below, but the syntax can be a little different in some APIs; see IsolineOperatorOutputType.
The default Lines is the usual choice, and the lines can have a value attribute and a depression attribute; some examples are given here and also below.
But sometimes it is useful to get the output as polygons instead, since you can then fill them with colors or patterns, and some kinds of map generalization will be easier to do.
The kind of raster input determines the possible type of output polygons. An IsolineOperator can handle two kinds of input rasters: either ordinary elevation rasters or else volume-encoding rasters from a LineOfSightOperator or an AirspaceCoverageOperator. For ordinary elevation rasters, the only allowed polygon types are AdjacentPolygons and OverlappingPolygons. And for volume-encoding rasters, the only allowed polygon type is VolumePolygons. (Outputting lines is always allowed.)
The polygons for volume-encoding rasters will have a single value attribute like the lines, and the value will be the altitude of the polygon contours, including any hole contours. When displayed in a 2D map, the iso contours for different altitudes can intersect each other, so it may be best to avoid clutter by using a small number of altitude levels – perhaps just one.
The polygons for ordinary elevation rasters will not have a single value attribute like the lines, but instead a minValue and a maxValue attribute that give the range of values for the polygon (unless LevelAttributeFormat is None). Special rules apply for the lowest and the highest range, if FromLevel or ToLevel has been set:
If a polygon has maxValue such that maxValue − LevelDistance < FromLevel, then the minimum raster cell value inside the polygon is unknown, so the minValue will either be the empty string or the smallest representable numeric attribute, depending on the LevelAttributeFormat:
minValue | levelAttributeFormat |
|---|---|
" " (the empty string) | String |
−2^63 | Int |
−1.797693e308 | Double |
If a polygon has minValue such that minValue + LevelDistance > ToLevel, then the maximum raster cell value inside the polygon is unknown, so the maxValue will either be the empty string or the largest representable numeric attribute, depending on the LevelAttributeFormat:
maxValue | levelAttributeFormat |
|---|---|
" " (the empty string) | String |
2^63 − 1 | Int |
1.797693e308 | Double |
For ordinary elevation rasters, the operator can generate the polygons in two different ways:
If OutputType = AdjacentPolygons, then the polygons will be adjacent with no overlap (but possibly with gaps where the input raster contained the undefined cell value). Most polygons will contain holes that are filled with smaller polygons. This type of polygon is normally easiest to use, but can be slower to generate.
If OutputType = OverlappingPolygons, then smaller polygons will appear inside larger polygons, and the larger polygons will not have holes that match the smaller polygons. The operator will generate larger polygons before smaller ones, so a solid fill pattern and opaque colors will produce a correct display, but other visualizations will require some postprocessing. This type of polygon is normally harder to use, but it is better for some kinds of map generalization that are asymmetric with respect to uphill/downhill. (Although these polygons normally have no holes, they will contain holes if they surround an area where the input raster cells are undefined.)
For the overlapping polygons, there are another attribute that is set:
the boolean depression attribute tells whether the polygon surrounds a depression instead of hill,
and, using this attribute, you can normally get the raster cell value along the polygon perimeter via this expression:
if depression then maxValue else minValue
However, the polygon perimeter does not always go through raster cells of constant value, because the polygon can end where the raster ends, or where the raster contains cells that are undefined. So this expression must be used with care.
If many polygons are generated, using AdjacentPolygons can be much slower than OverlappingPolygons. If the polygons need semitransparent fill colors, but do not need patterns, there is a trick that allows you to use OverlappingPolygons and still get well-behaved semitransparancy: use a polygon visualizer with fully opaque colors, and send the result to a RasterizeOperator with useVisualizers = True. Then you can decrease the Layer.Opacity.
Examples
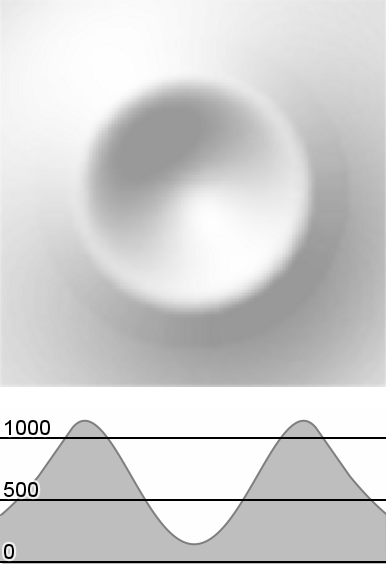
Our first example shows various output types for an ordinary elevation raster: an artificial raster of a hill with a crater.
 |
Lines
The default choice of OutputType is Lines, which gives four line features as output:
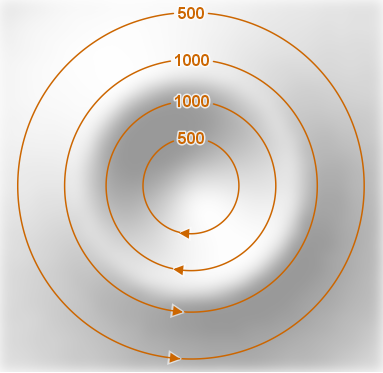 |
Each line gets a value attribute, and the right hand side of each line faces downhill, so only the depression contours in the crater go clockwise. If the operator generates an entire line as a closed loop, the line will get a boolean depression attribute set. However, if the loop spans more than one raster tile, and the View.Area or the current TileLayer tile does not cover all these raster tiles, the operator cannot decide whether or not the line surrounds a depression, so the depression attribute will not be set.
Adjacent polygons
If we choose OutputType = AdjacentPolygons, then the output consists of the areas between the contour lines, represented as polygon features:
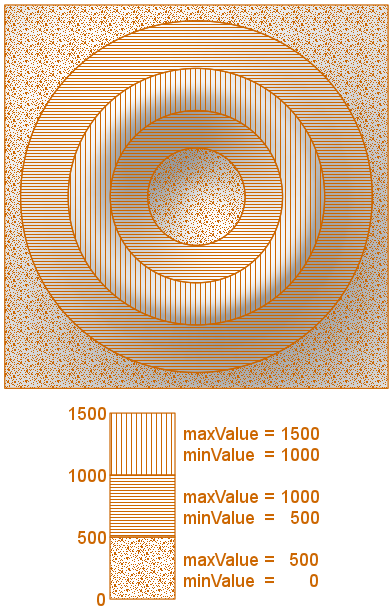 |
The polygons do not overlap, since the larger polygons get holes where the smaller polygons fit. This makes it possible to use polygon fill patterns as above.
Overlapping polygons
If we choose OutputType = OverlappingPolygons, then the larger polygons will not get holes, so the smaller polygons overlap them. We want to avoid doing postprocessing in this example, so we just use a solid polygon fill pattern and opaque colors: this works since the operator generates larger polygons before smaller:
 |
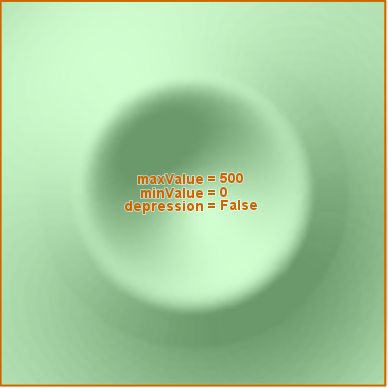
We did not use any line visualizer here (just a semi-transparent hillshading on top), and the resulting image could have been configured much easier by applying a RasterVisualizer directly to the elevation raster, without any IsolineOperator. However, let us look at each individual polygon feature we get, and its attributes:
 |
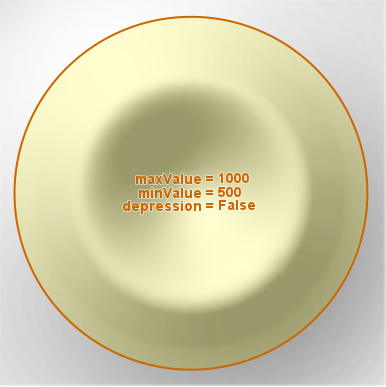 |
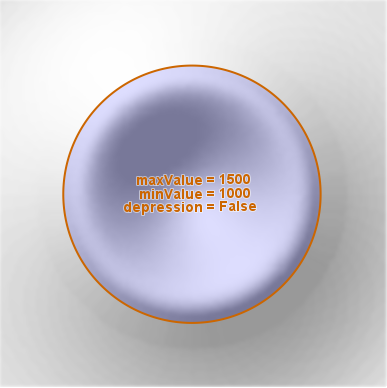 |
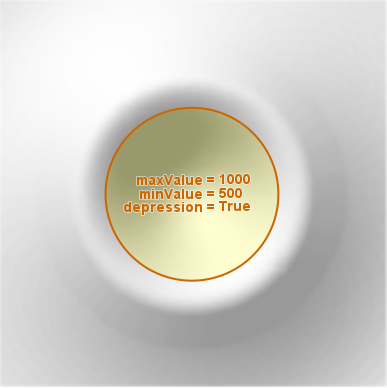 |
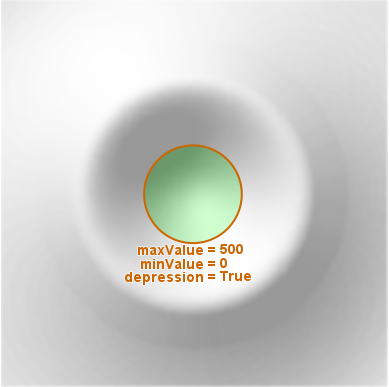 |
Note that the minValue and maxValue attributes do not correctly describe the range of values inside each individual polygon – to get a correct visualization, it is necessary to find some way to make the smaller polygons completely obscure the larger ones. In other words, each polygon represents a hole in its surrounding polygon, but only implicitly.
Purpose
Overlapping polygons without holes make it easier to do map generalization that is asymmetric with respect to uphill/downhill.
Let us say that we are planning aircraft routes with a given altitude: then terrain higher than some threshold value is dangerous and should be displayed on the map. In general, there can be several levels of dangers that should be displayed together. However, the outline of the dangerous area should be smoothed and simplified so it does not clutter the map. For safety reasons, it is permitted to make the area larger but not smaller. So, a ridge that extrudes from a mountain area is a real danger even if it is narrow, and cannot be removed. But a narrow valley that goes a short distance into the mountain area would be safe but uninteresting, since it is not useful to fly into the valley just to make a U-turn; such a valley should be removed. The required kind of polygon generalization can be implemented by polygon dilation downhill by some distance, followed by polygon union, and then polygon erosion uphill by the same distance. The dilation downhill can be implemented by a buffer zone operation with a radius that is positive if the attribute depression is False, and negative otherwise. The polygon union can be handled by the ConnectPolygonOperator, and the final erosion uphill can be made by a buffer zone made by the negated radius of the first buffer zone.
The result can be displayed with the solid fill pattern and opaque colors, as we did above. Other visualizations will require more work:
To get semi-transparent colors, an easy workaround is to convert the result to a temporary image raster of opaque colors by using a RasterizeOperator with useVisualizers = True, and then decrease the Layer.Opacity.
To use non-solid fill patterns, it is necessary to let each polygon punch a hole in its surrounding polygon, by writing a custom operator or a ScriptOperator that calls the GeometryClipper.ClipPolygon method with the Difference operation.
(This implementation technique for polygon dilation and erosion does not work with the other type of polygon output, OutputType = AdjacentPolygons, since a polygon could then have part of its boundary facing uphill and another part facing downhill, which would confuse the buffer zone operation.)
Volume polygons
A second example is needed to to illustrate isolines for volume-encoding rasters.
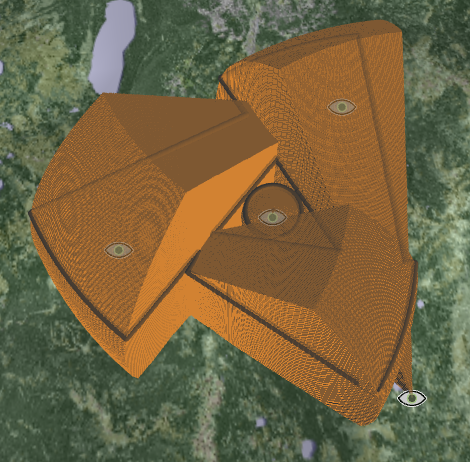 |
This 3D screenshot shows the combined viewshed volume of four observers, produced by an AirspaceCoverageOperator, as well as the isolines for a certain altitude, using OutputType = Lines.
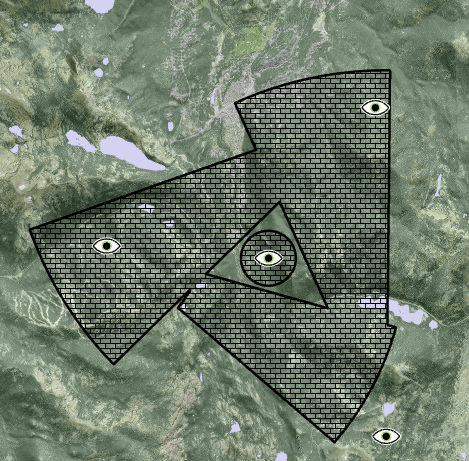 |
In this second screenshot, a 2D map shows the isopolygons for the same altitude, using OutputType = VolumePolygons. The somewhat contrived example shows how the three isolines form two polygons: one small and circular and one larger with a triangular hole.
Platforms
Windows, Linux, Android