3D Configuration Tutorial
This tutorial will show you how to create a 3D configuration. It shows how to use elevation data together with 2D layers to set up a 3D surface and finally how to add text labels for points of interest.
Prerequisites: You should have read Basic Vector Configuration Tutorial and Carmenta Studio User's Guide.
The result of this tutorial is similar to the "3d_tahoe.px" sample configuration file in the Carmenta Engine SDK.
This tutorial uses the Carmenta Engine samples geodata which, by default, is installed in:
C:\Program Files (x86)\Carmenta\Carmenta Engine Samples Geodata 5.15\geodata
on Windows and:
/usr/share/carmenta/geodata-5.15
on Linux.
Step 1: Setting things up
Open a new configuration in Carmenta Studio.
Start by dragging a GlobeView object, which is used for 3D configurations, from the list of 3D objects in the Classes tab and drop it in our configuration.
Then drag a BitmapDrawable object from the list of Commonly used objects and drop it in our GlobeView.
We don't need to set up a coordinate reference system. The coordinate reference system used in the GlobeView is always Crs.Wgs84LongLat; elevations are specified in meters above sea level. You may use application data in different reference systems, but for performance reason you should use Crs.Wgs84LongLat for your datasets whenever possible.
Next we will set up a start position for the camera that gives us a nice initial view of the data
Set the cameraPoint property of the GlobeView to [ 0.0, 0.0, 10000000.0 ] which represents a position 10 million meters above sea level at 0 degrees longitude and latitude. Since the camera is above ground we also want to rotate it so it is tilted toward the ground by setting cameraPitch property to -90.
We will also change the position of the sun which will alter how lighting is applied to the 3D ground. The position of the sun is also used in calculations in various operators, for example the ShadowOperator, but in this tutorial it is only used to modify the lighting.
Drag a SunPosition object from the list of Miscellaneous objects in the Classes tab and drop it on the GlobeView.
Set the date and time in the SunPosition object to May 6, current year, 3 p.m. (month to 5, day to 6 and hour to 15).
Step 2: Adding global data
When using a GlobeView it is good practice to configure global data so that users are presented with an easier to grasp and interesting view when zooming out. In this tutorial we will use global elevation data and global orthoimagery from the Carmenta Engine samples geodata.
First we will add the elevation data.
Drag a ReadOperator object from the list of Commonly used objects in the Classes tab and drop it on the GlobeView. Make sure you add the ReadOperator to elevationInput and not to the auxiliaryGroundInput. The following image shows the context menu used to select which input the ReadOperator is added to.
 |
Drag an ImageDataSet object from the list of Data reading objects in the Classes tab and drop it on the ReadOperator.
Change the name of the ImageDataSet to GlobalElevationData.
Set the path property by browsing (press
 in the property value field) to the GMTED2010 directory in the Carmenta
Engine samples geodata.
in the property value field) to the GMTED2010 directory in the Carmenta
Engine samples geodata.Set the rasterCachePolicy property to Overviews. This will improve performance when reading elevation data in different resolutions, see RasterCachePolicy for more information.
Set the rasterCacheFilter property to Average, see RasterCacheFilter for more information on the different filters available.
Set the indexPath property to a location where Carmenta Engine can save the generated index and raster cache files. Press
 in the property value field and browse to, for example, C:\Temp on Windows or /tmp on Linux.
Set the continuous property to True.
Next up is adding orthoimagery to the configuration.
Drag an OrdinaryLayer object from the list of Commonly used objects in the Classes tab and drop it on the GlobeView. (Make sure you add the OrdinaryLayer to surfaceLayers and not to the layers.) The following image shows the context menu used to select which layer list the OrdinaryLayer is added to.
 |
Drag a ReadOperator object from the list of Commonly used objects in the Classes tab and drop it on the OrdinaryLayer.
Drag an ImageDataSet object from the list of Data reading objects in the Classes tab drop it on the ReadOperator.
Change the name of the ImageDataSet to GlobalOrthoimagery.
Set the path property by browsing (press
 in the property value field) to the BlueMarbleNG directory in the Carmenta
Engine samples geodata (see the start of the tutorial for the default location of the samples geodata).
in the property value field) to the BlueMarbleNG directory in the Carmenta
Engine samples geodata (see the start of the tutorial for the default location of the samples geodata).Set the rasterFilter property to Bicubic. This will determine how the raster is filtered when visualized, see RasterFilter for more information.
Set the indexPath property to a location where Carmenta Engine can save the generated index and raster cache files. Press
 in the property value field and browse to, for example, C:\Temp on Windows or /tmp on Linux.
Your configuration should now look something like:
 |
Save the configuration and open it in Carmenta Explorer, you should see the following:
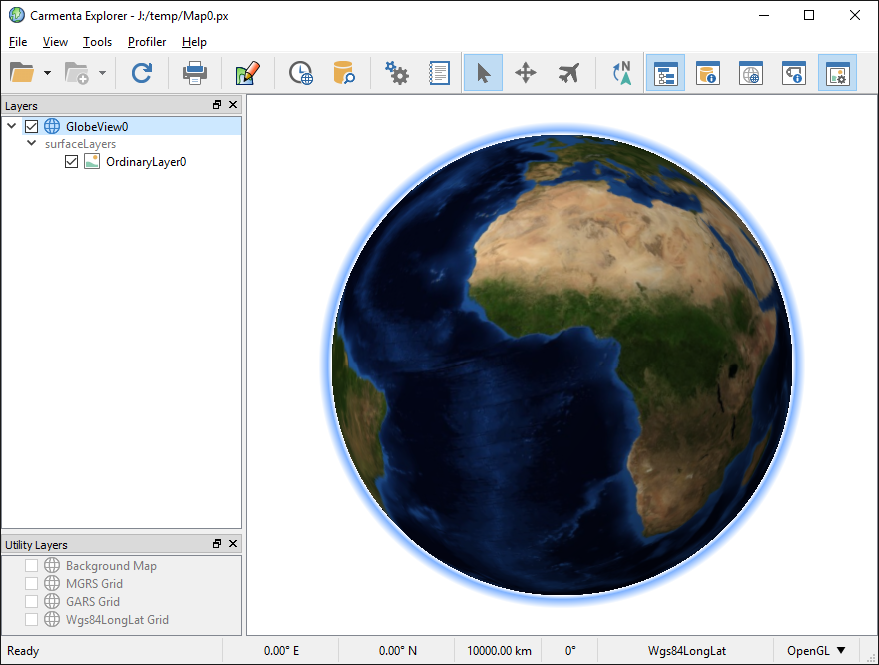 |
Step 3: Adding detailed elevation data
We are now ready to start adding detailed data to our configuration.
Drag a FunnelOperator object from the list of Data processing objects in the Classes tab and drop it on the GlobeView and specify that it should be added to elevationInput. This will allow us to add more than one elevation data source.
Drag a ReadOperator object from the list of Commonly used objects in the Classes tab and drop it on the FunnelOperator.
The detailed elevation raster data that will be used for this tutorial is in BIL-format (.bil files) which can be read by the HdrDataSet.
Drag an HdrDataSet object from the list of Data reading objects in the Classes tab drop it on the new ReadOperator.
Change the name of the HdrDataSet to DetailedElevationData.
The coordinate reference system we need is "NAD27 / UTM zone 10N", which uses the North American Datum of 1927 together with Universal Transverse Mercator zone 10N.
Drag a Crs object from the list of Crs and Projection objects in the Classes tab and drop it on DetailedElevationData. Change the name of the new Crs to Nad27Utm10N.
Change the authorityCode property of the Crs object to 26710. The authority property should remain epsg. This is the EPSG code for our new coordinate reference system.
Normally this would be enough, but since the geodetic datum is NAD27 we must also set the datumShiftChoice property of the new coordinate reference system to Lenient. This means that the default datum shift for NAD27 will be used despite lower accuracy in some areas; see the image on the DatumShiftChoice page for more information. In our test area the accuracy is about 2 meters which is okay for our purposes. (Better accuracy would require us to specify the projection and the geodeticDatum, where the latter should be a NAD27 implementation with an explicit datum shift.)
Now we can configure the HdrDataSet to read the more detailed elevation data.
Set the path property by browsing (press
 in the property value field) to the LakeTahoe/dem directory in the Carmenta
Engine samples geodata (see the start of the tutorial for the default location of the samples geodata).
in the property value field) to the LakeTahoe/dem directory in the Carmenta
Engine samples geodata (see the start of the tutorial for the default location of the samples geodata).Set the fileName property to tahoe10.bil (the name of the sample geodata file that contains the elevation data for Lake Tahoe).
Set the rasterCachePolicy property to Overviews. This will improve performance when reading elevation data in different resolutions, see RasterCachePolicy for more information.
Set the indexPath property to a location where Carmenta Engine can save the generated index and raster cache files. Press
 in the property value field and browse to, for example, C:\Temp on Windows or /tmp on Linux.
When we now have added more detailed local data we want to change our camera position to present the area with detailed data instead of the whole world.
Set the cameraPoint property of the GlobeView to [ -119.9, 39.0, 3800.0 ] that is a good camera position for Lake Tahoe. Since the camera is above ground we also want it rotated so it is tilted toward the ground. We also want it oriented toward the lake itself so set the cameraBearing property to -20 and cameraPitch property to -20.
Your configuration should now look something like:
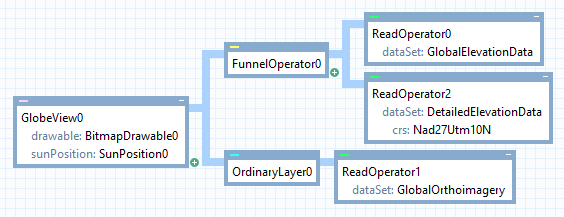 |
Save the configuration and open it in Carmenta Explorer, you should see the following:
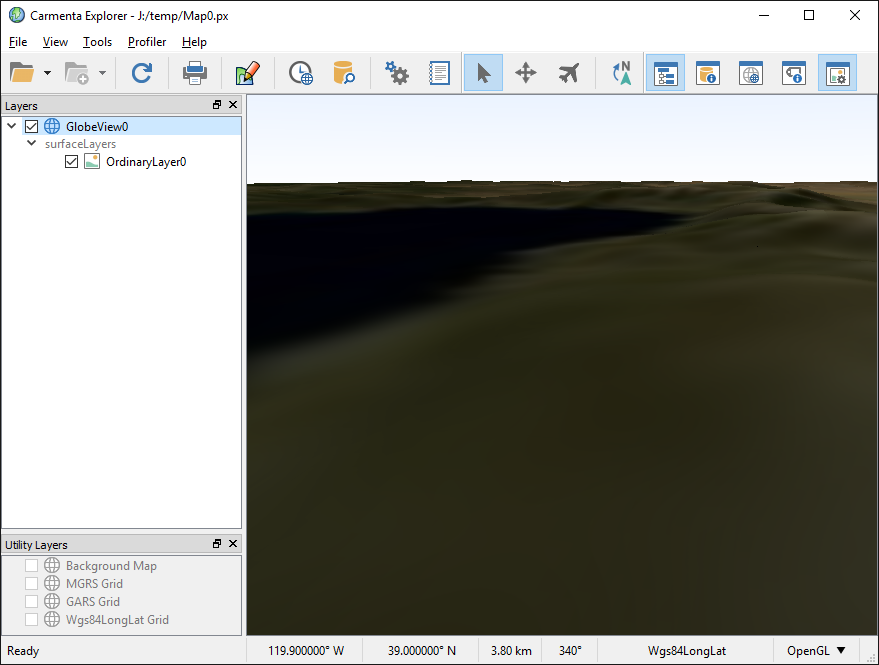 |
Step 4: Texturing the ground with 2D map layers
As texture for our 3D model we will copy 2D layers from the topographic_map.px sample into our 3D map configuration.
Load the sample map configuration topographic_map.px located in the Samples/MapConfigurations directory in the Carmenta Engine installation directory into Carmenta Studio. This map is over the same area as the elevation data used in this tutorial.
Right-click on the LandUse_new_colors layer and select Copy All to copy the layer and its entire operator chain and paste it into the 3D map configuration (press Ctrl + V or right click in the 3D map configuration and select Paste).
Repeat the same steps to copy the Aerial_photo_bw layer into the 3D map configuration.
Repeat the same steps to copy the Water layer into the 3D map configuration.
Drag and drop each layer onto the GlobeView and add them to surfaceLayers in this order: Aerial_photo_bw, LandUse_new_colors and Water. Make sure you drop the Water layer (which is a LayerSet) where the following image indicates so that it is added as a sibling layer of Aerial_photo_bw and LandUse_new_colors and not as a parent layer:
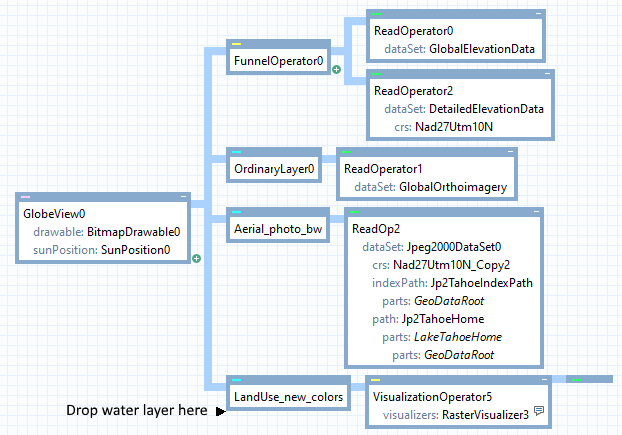 |
The copied LandUse_new_colors and Aerial_photo_bw layers are disabled. Enable them by setting their enabled properties to True.
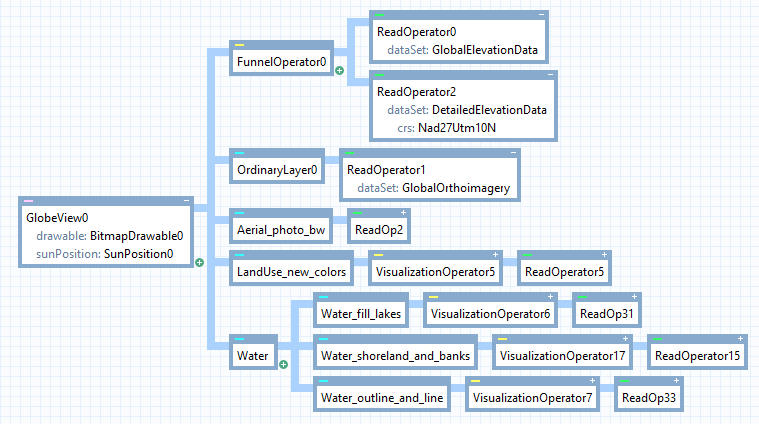
The map configuration should now look something like this in Carmenta Studio (note that some of the copied layers have been collapsed to make the image smaller):
 |
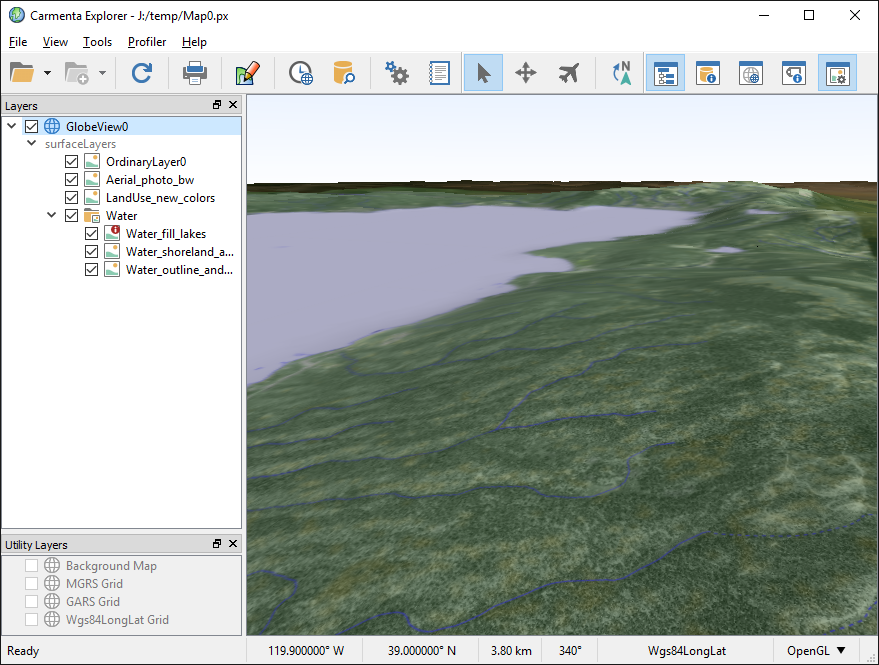
Save the configuration and open it in Carmenta Explorer. You should now see the ground textured with a mixture of aerial photos, land use raster and some vector data water polygons and lines (such as lakes and rivers), like this:
 |
Step 5: Visualize areas with text
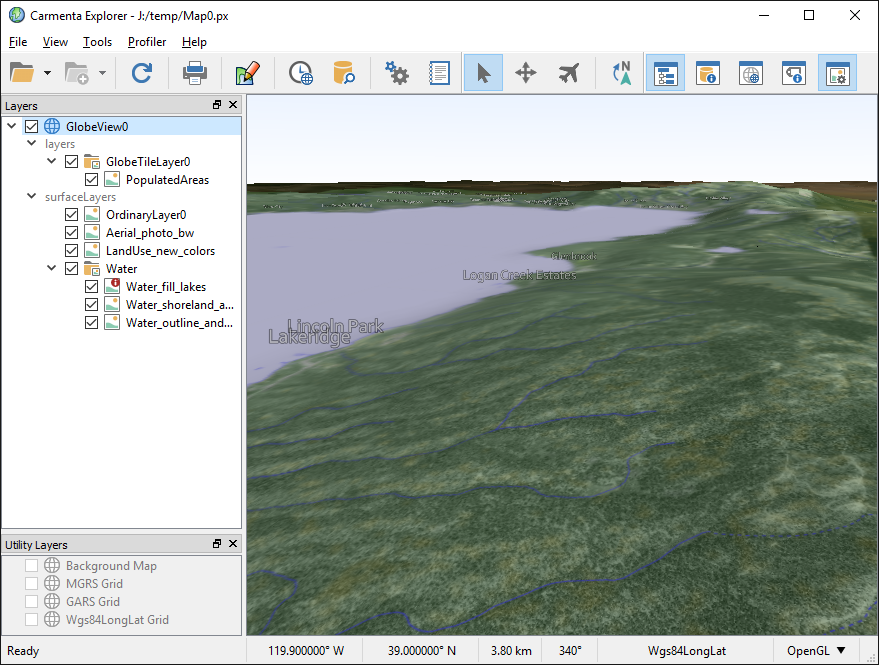
The final step of this tutorial is to display the names of the populated areas as billboards. For this we will use a GlobeTileLayer.
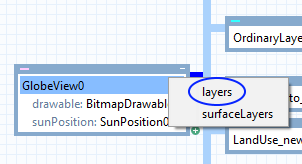
Drag a GlobeTileLayer object from the list of 3D objects in the Classes tab and drop it on the GlobeView. Make sure you add the GlobeTileLayer to layers and not to the surfaceLayers. The following image shows the context menu used to select which layer list the GlobeTileLayer is added to.
 |
Drag an OrdinaryLayer object from the list of Commonly used objects and drop it on the GlobeTileLayer.
Change the name of the OrdinaryLayer to PopulatedAreas.
Next we will add text visualization for the populated areas.
Drag a VisualizationOperator object from the list of Commonly used objects and drop it on the PopulatedAreas layer.
Drag a TextVisualizer object from the list of Commonly used objects and drop it on the VisualizationOperator. Select visualizers in the popup menu that appears.
Set the alignX property to Middle.
Set the antiAlias property to True.
Set the color property to a semi-transparent white color [ 255, 255, 255, 127 ]
Set the haloColor property to [ 0, 0, 0, 100 ]
Set the haloWidth property to 10.
Set the lengthUnit property to NominalMeters to make the size depend on the distance from the camera.
Set the offsetZ property to 200 to offset the text 200 meters vertically.
Select the text property in the property panel and press the
 button.
Choose "Value from feature attribute" and enter NAME as Attribute name. Then click OK to close the dialog.
button.
Choose "Value from feature attribute" and enter NAME as Attribute name. Then click OK to close the dialog.Drag a Font object from the list of Visualization objects in the Classes tab and drop it on the TextVisualizer. Change the name of the Font object to Corbel200Font and set the fontName property to Corbel-200-normal-normal. This will, in combination with setting the lengthUnit property to NominalMeters, make the letters approximately 200 meters tall.
Next we have to make the map configuration read the populated area information which is stored in a Shapefile.
Drag a ReadOperator object from the list of Commonly used objects and drop it on the VisualizationOperator.
Drag a ShapefileDataSet object from the list of Data reading objects in the Classes tab and drop it on the ReadOperator.
Change the name of the ShapefileDataSet to PopulatedAreasDataSet.
Set the fileName property to *cities.shp (the data contains more populated areas but we are only interested in the cities).
Set the path property by browsing (press
 in the property
value field) to the LakeTahoe/geonames directory in the Carmenta Engine samples geodata
(see the start of the tutorial for the default location of the samples geodata).
You don't need to specify the crs property; if you leave it blank the dataset will figure out the CRS automatically from the data files.
The final step is to make the texts appear relative to the ground (and not relative to z = 0).
Set the groundRelative property at the PopulatedAreas layer to True.
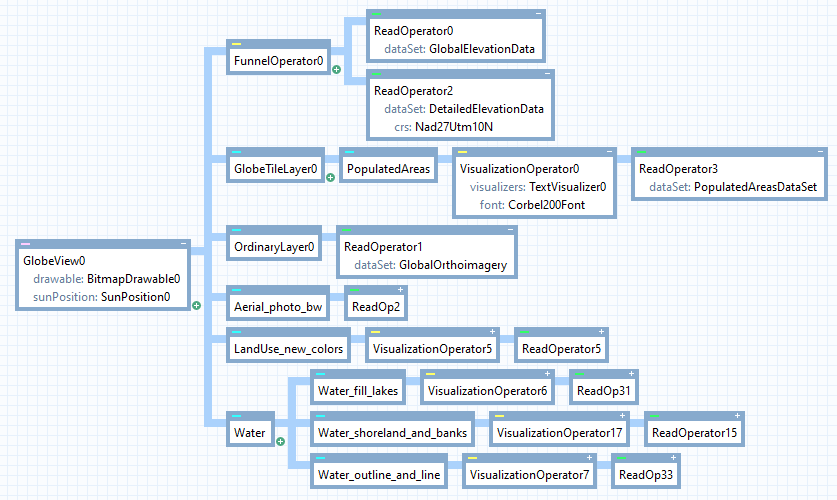
The map configuration should now look like this in Carmenta Studio (the layers copied from topographic_map.px have been collapsed):
 |
Save the configuration and open it in Carmenta Explorer. The city areas should now show up like in the following screen shot:
 |
Congratulations! You have learned how to create a 3D map configuration combining elevation data with textures and visualizing city areas using texts.