VerticalProfileOperator.MaxDistance Property
Gets or sets the maximal distance from the route, at which 3D input can generate output.
Syntax
public System.Double MaxDistance { get; set; }Property Value
Default: 0.0
A distance in meters. Raster cells and vector data that are nearer the route will affect the output.
Remarks
The 3D features from ElevationInput generate output only where their horizontal distance from the route is less than MaxDistance meters.
You can find example screenshots, with a zero and a 500 meter max distance, at the Introduction section at the class page.
Here, we describe the effect in detail for each kind of input type:
Points
A 3D point from ElevationInput will generate an output feature, if its horizontal distance to the route is less than MaxDistance. The horizontal distance will be attached to the output point (if any) as the new attribute vpopDistanceToRoute, which is a signed number, with positive numbers meaning left of the route.
Lines and Polygons
First, a horizontal buffer zone polygon with a radius of MaxDistance is generated around the route line. Then, each line feature or polygon feature from ElevationInput is clipped by the buffer zone, and each remaining piece will generate an output feature for the profile. As for point input, the new attribute vpopDistanceToRoute is attached to each output feature, giving the (signed) horizontal distance to the route from the nearest part of the clipped input feature.
When the MaxDistance is positive and an input line feature passes near a node of the route, the output lines will be interrupted at the node. That is, there will be one output line to the left of the node and another one to the right. But these two pieces will normally meet at the same elevation, so the interruption is usually not visible. If a single output line feature is desirable, the pieces can often be connected by a ConnectLineOperator.
Raster
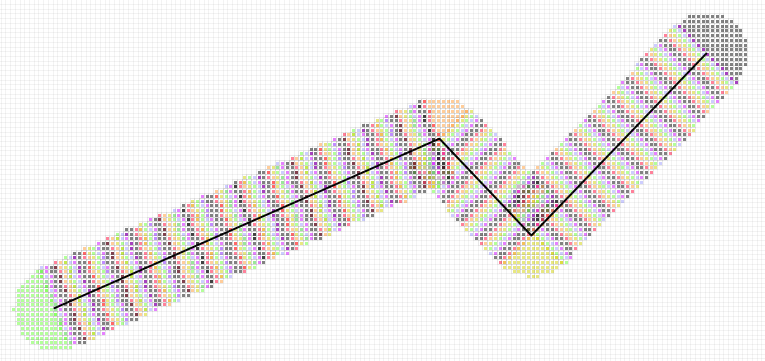
Raster cells can contribute to the output if they are within MaxDistance from the route. For each point generated for the output line, the raster cells are examined along a short sample line of length 2*MaxDistance and perpendicular to the route. For an ordinary raster of ground elevations, the highest cell value on the sample line will become the elevation of this output point. At a corner of the route, the raster cells will also be sampled in a sector at the outside of the corner. (The first and last points are also considered as corners of the route, and cells will be sampled in a half-circle before the first point, and beyond the last.)
The image below shows the raster cells that are scanned (the image is an ordinary 2D view, so the route is seen from above).
 |
A special case occurs when the operator gets a raster of land-cover heights above ground from LandCoverHeightInput, apart from the ground elevation raster from ElevationInput. It is then the resolution of the ground elevation raster that determines where elevations shall be examined, and the maximum that is used for each short perpendicular sample line is defined as the maximum of the treetop elevations above sea level.
Another special case occurs when the input consists of volume-encoding rasters from a AirspaceCoverageOperator, although the behavior is a generalization of the behavior for ground elevation rasters.
Where the short perpendicular sample line follows the top surface of a volume, the corresponding node in the output polygon will represent the highest surface point along the sample line.
Conversely, where the short perpendicular sample line follows the bottom surface of a volume, the corresponding node in the output polygon will represent the lowest surface point along the sample line.
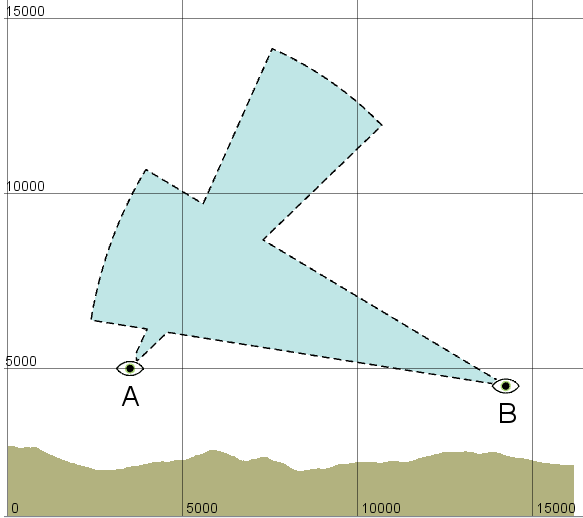
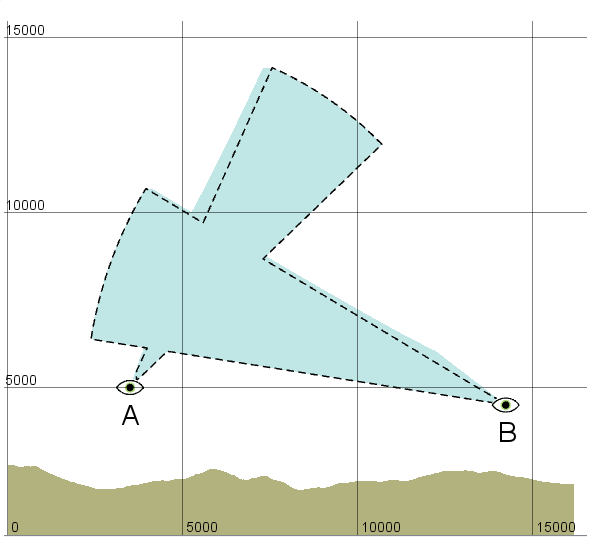
So the profile polygons for the volumes can grow both upward and downward with increased MaxDistance, but they can never shrink. One can think of a profile route with a positive MaxDistance as cutting out a narrow vertical slice of the volumes, and then squeezing the slice flat.
 |
 |
If you pilot a military aircraft, you do not want to fly into the viewsheds of hostile air defense systems, so the MaxDistance represents your possible deviation from your planned flight route, and it make sense that the viewshed profiles grow with increased MaxDistance. In this way, the expanded viewshed profiles will represent the worst case scenario.
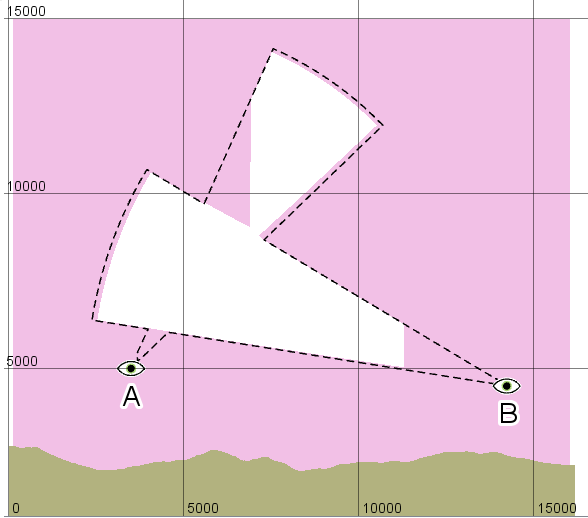
On the other hand, a AirspaceCoverageOperator can also be configured to generated the volume-encoding rasters for the complement of the viewshed volumes, relative to some area of interest:
 |
As the image shows, the complement profiles will also grow with increased MaxDistance. This kind of result is useful if it is you who operate the air defense systems, and you expect a hostile aircraft along a flight route with a possible deviation of MaxDistance. The expanded complement profiles will then represent the worst case scenario from your point of view.
Platforms
Windows, Linux, Android